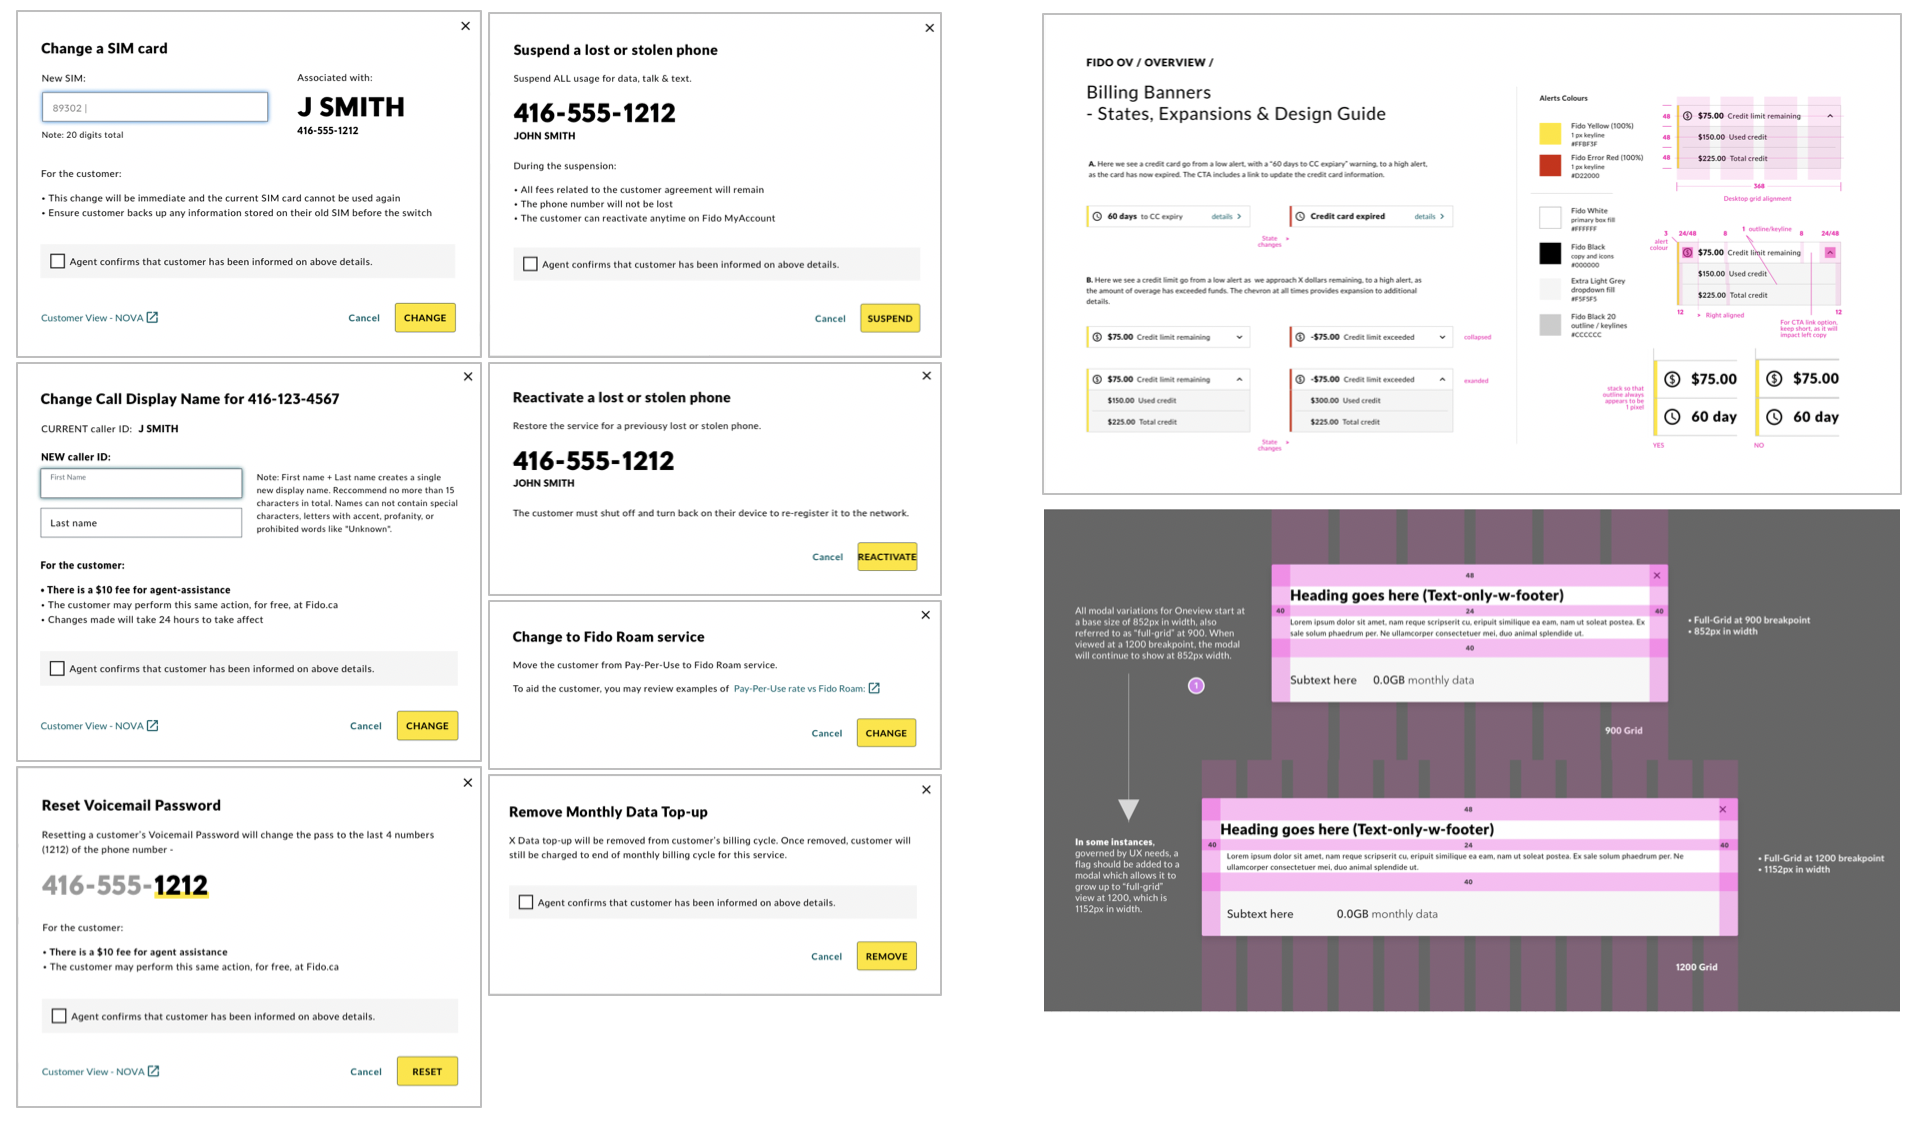
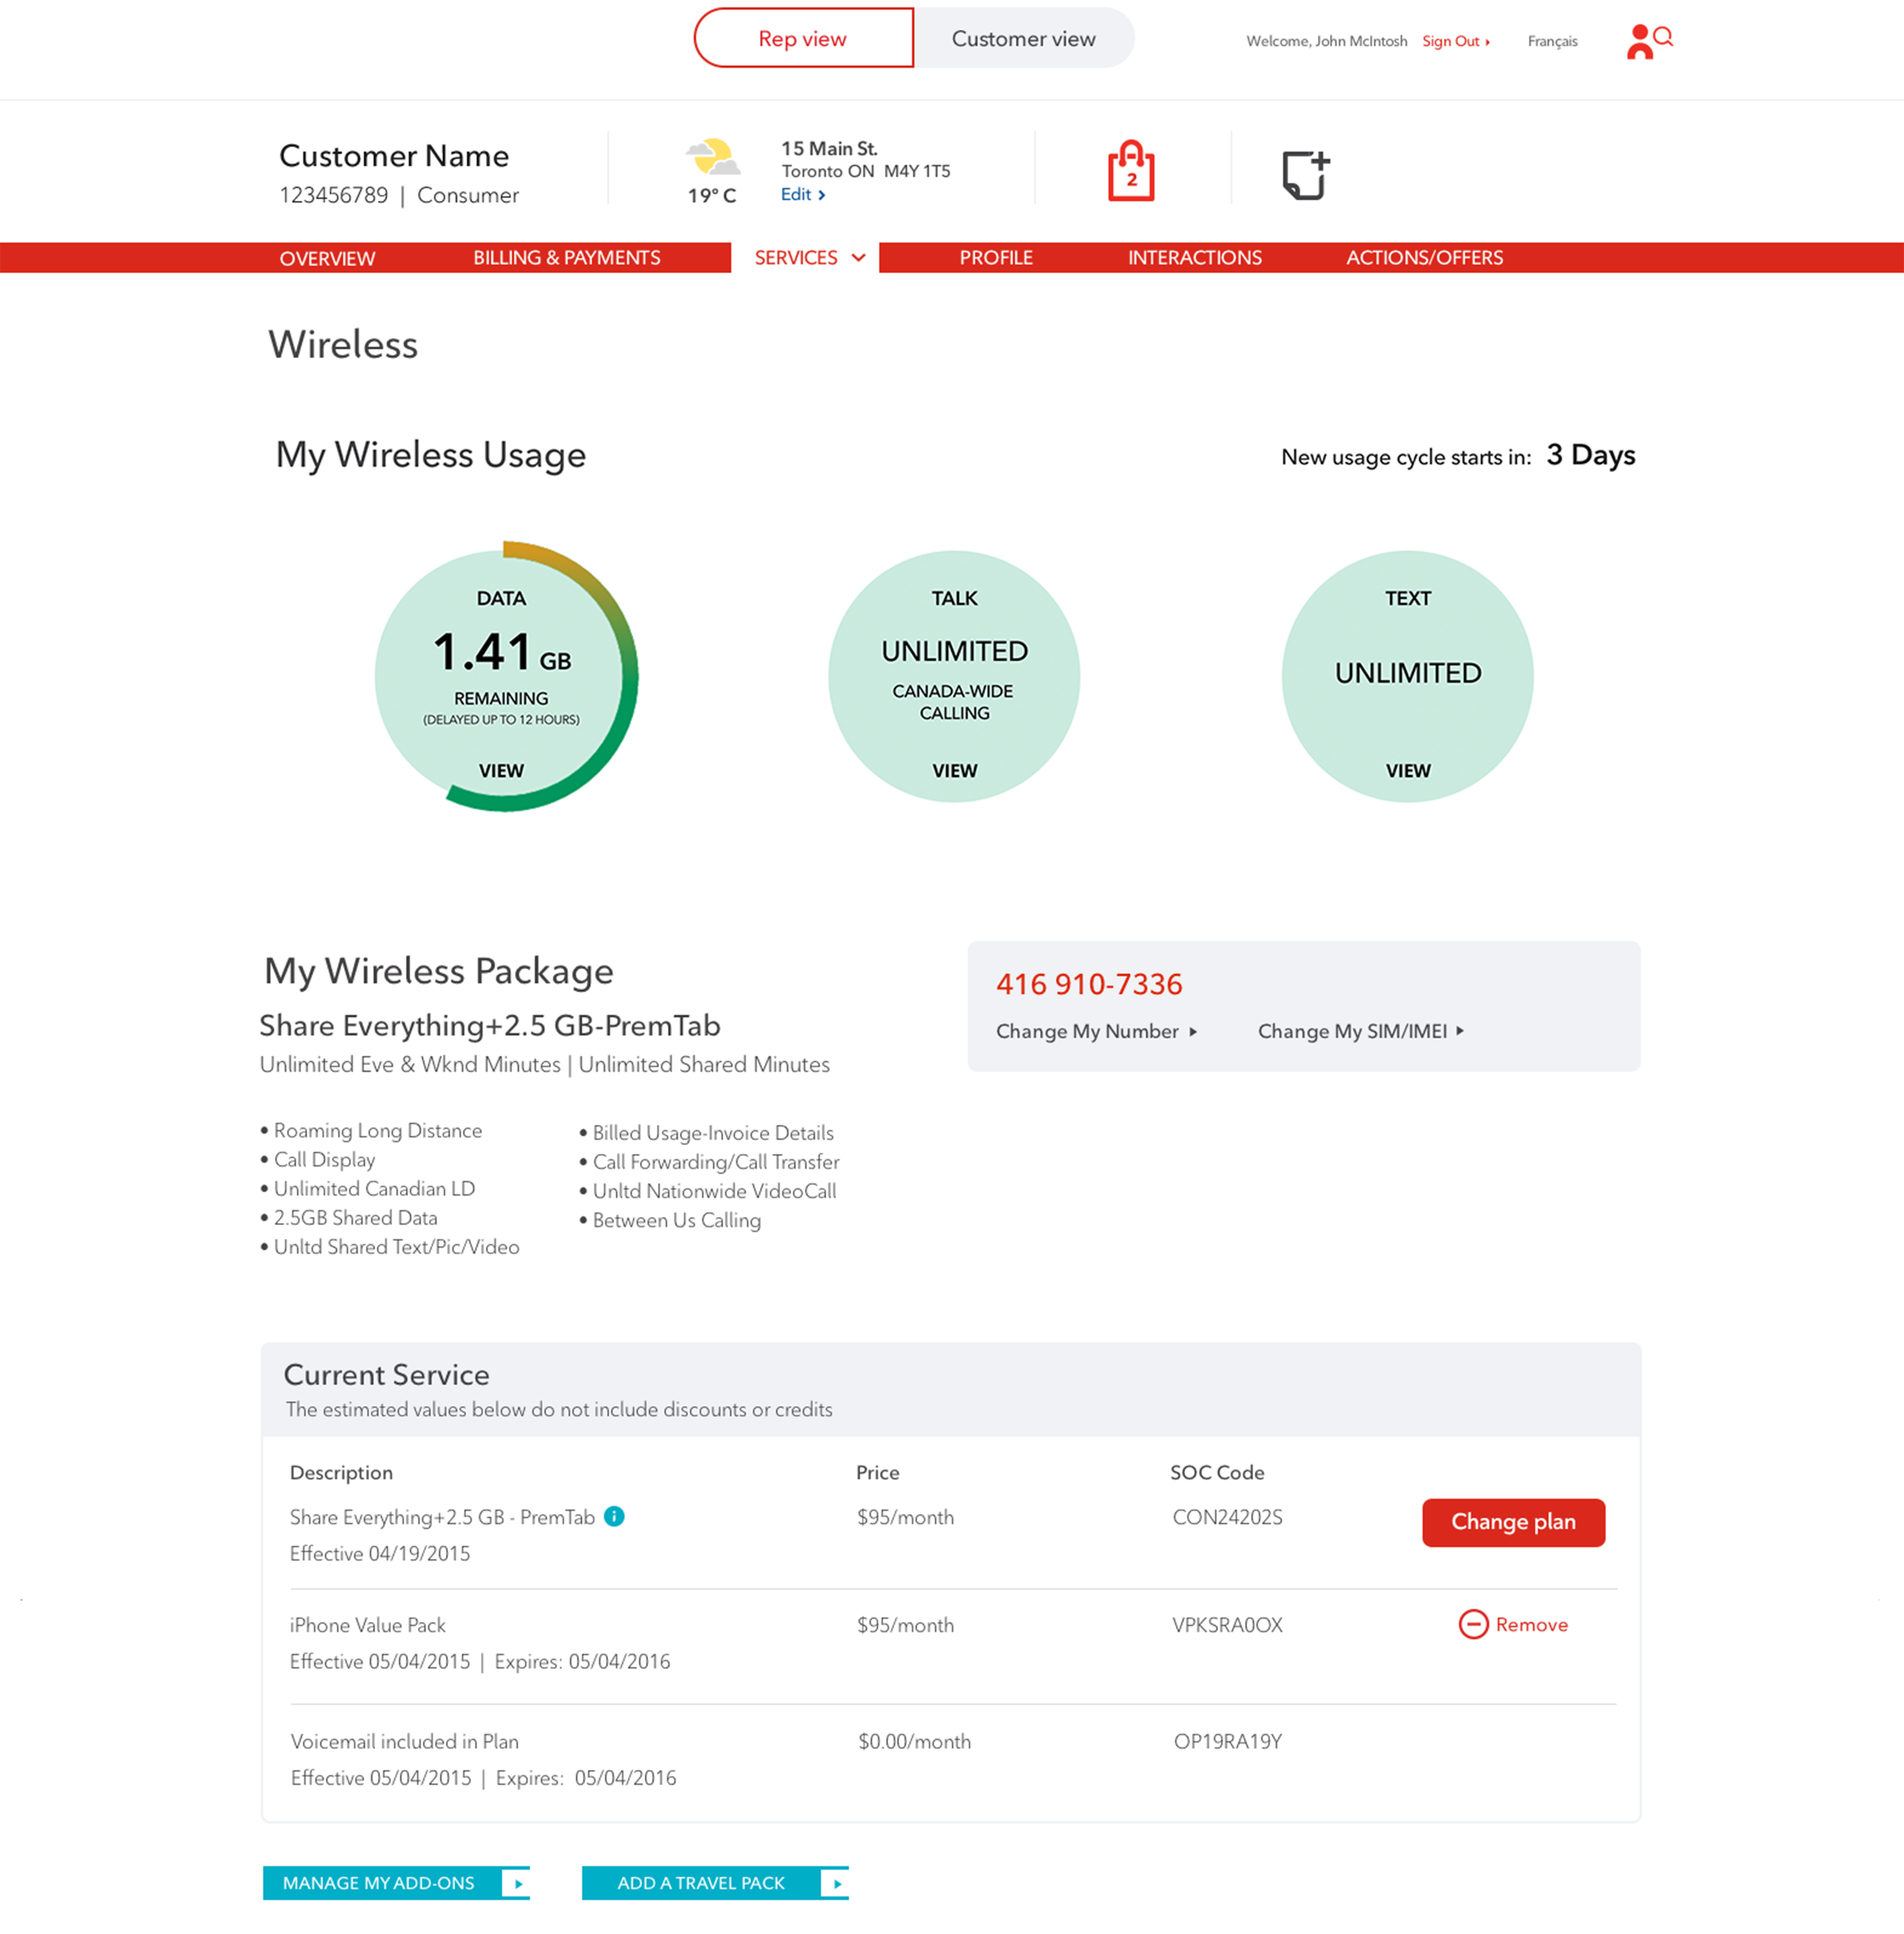
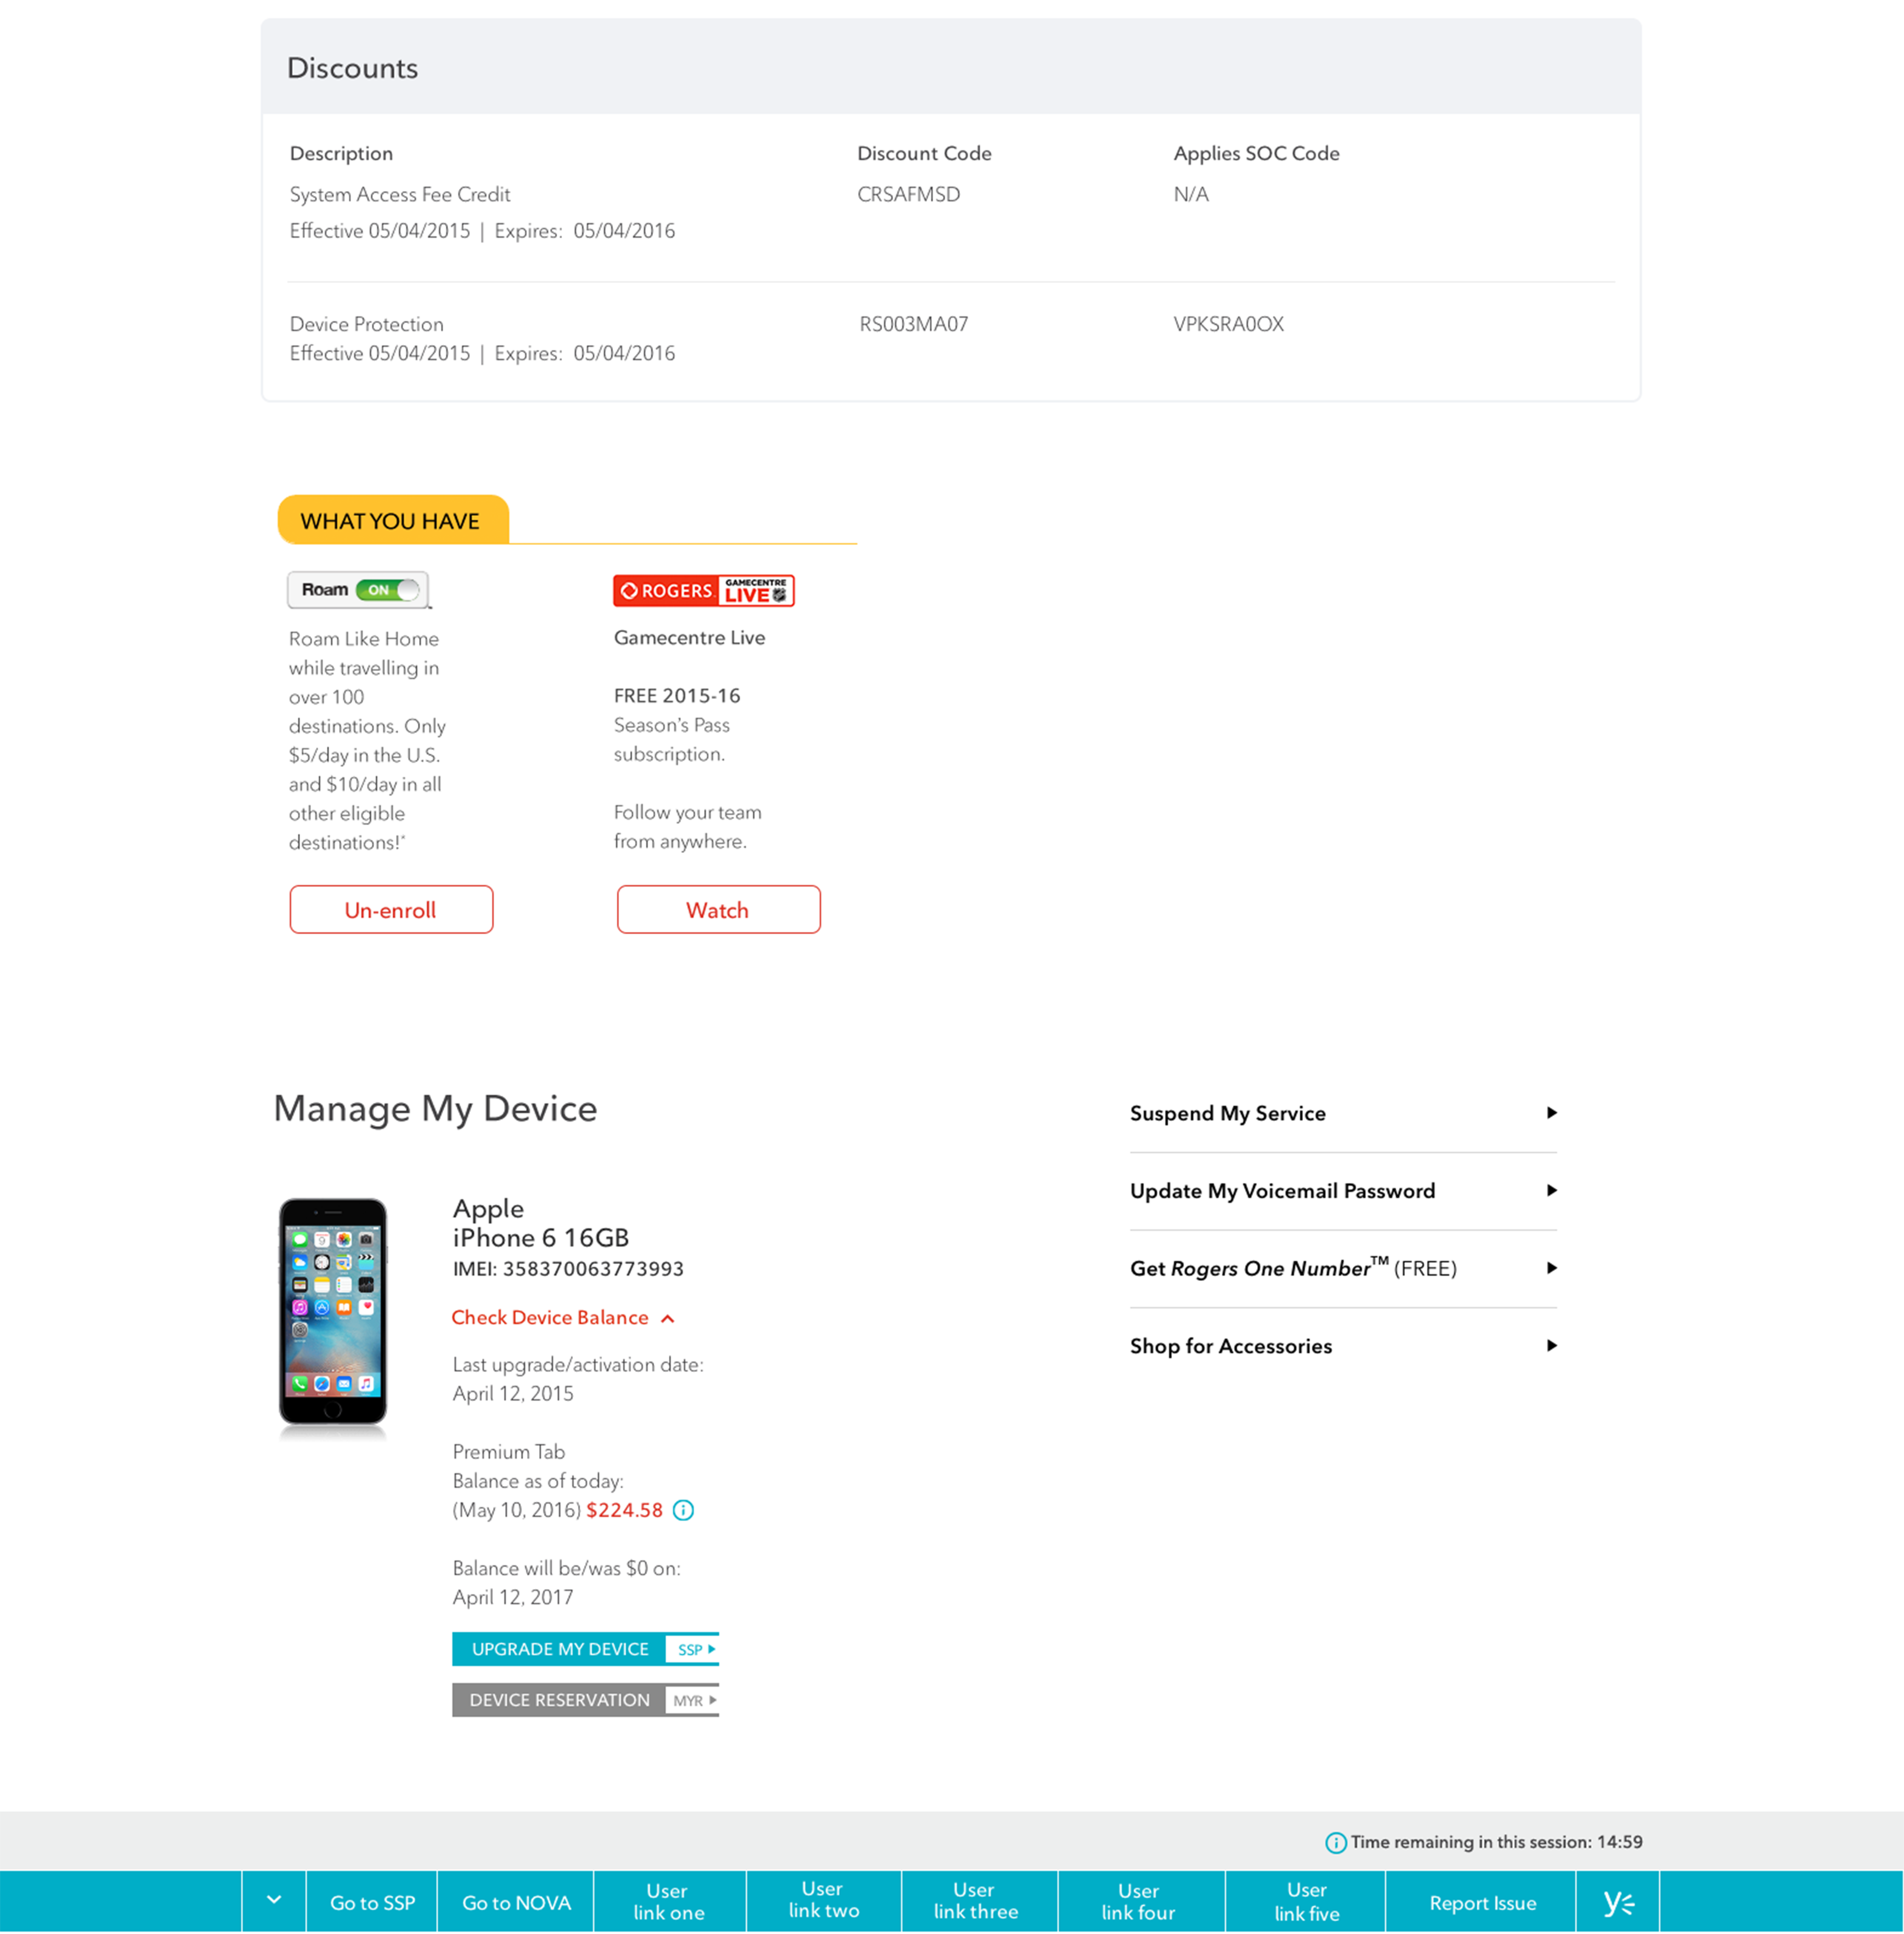
Problem Space — Redesigning the Existing Dashboard
Wireless Service Dashboard is a core function module within the OMNI-Channel Sales & Service Platform, covering usage inquiry, service detail inquiry, service change requests, and device upgrades. The existing version had accumulated significant usability debt that required a full redesign.
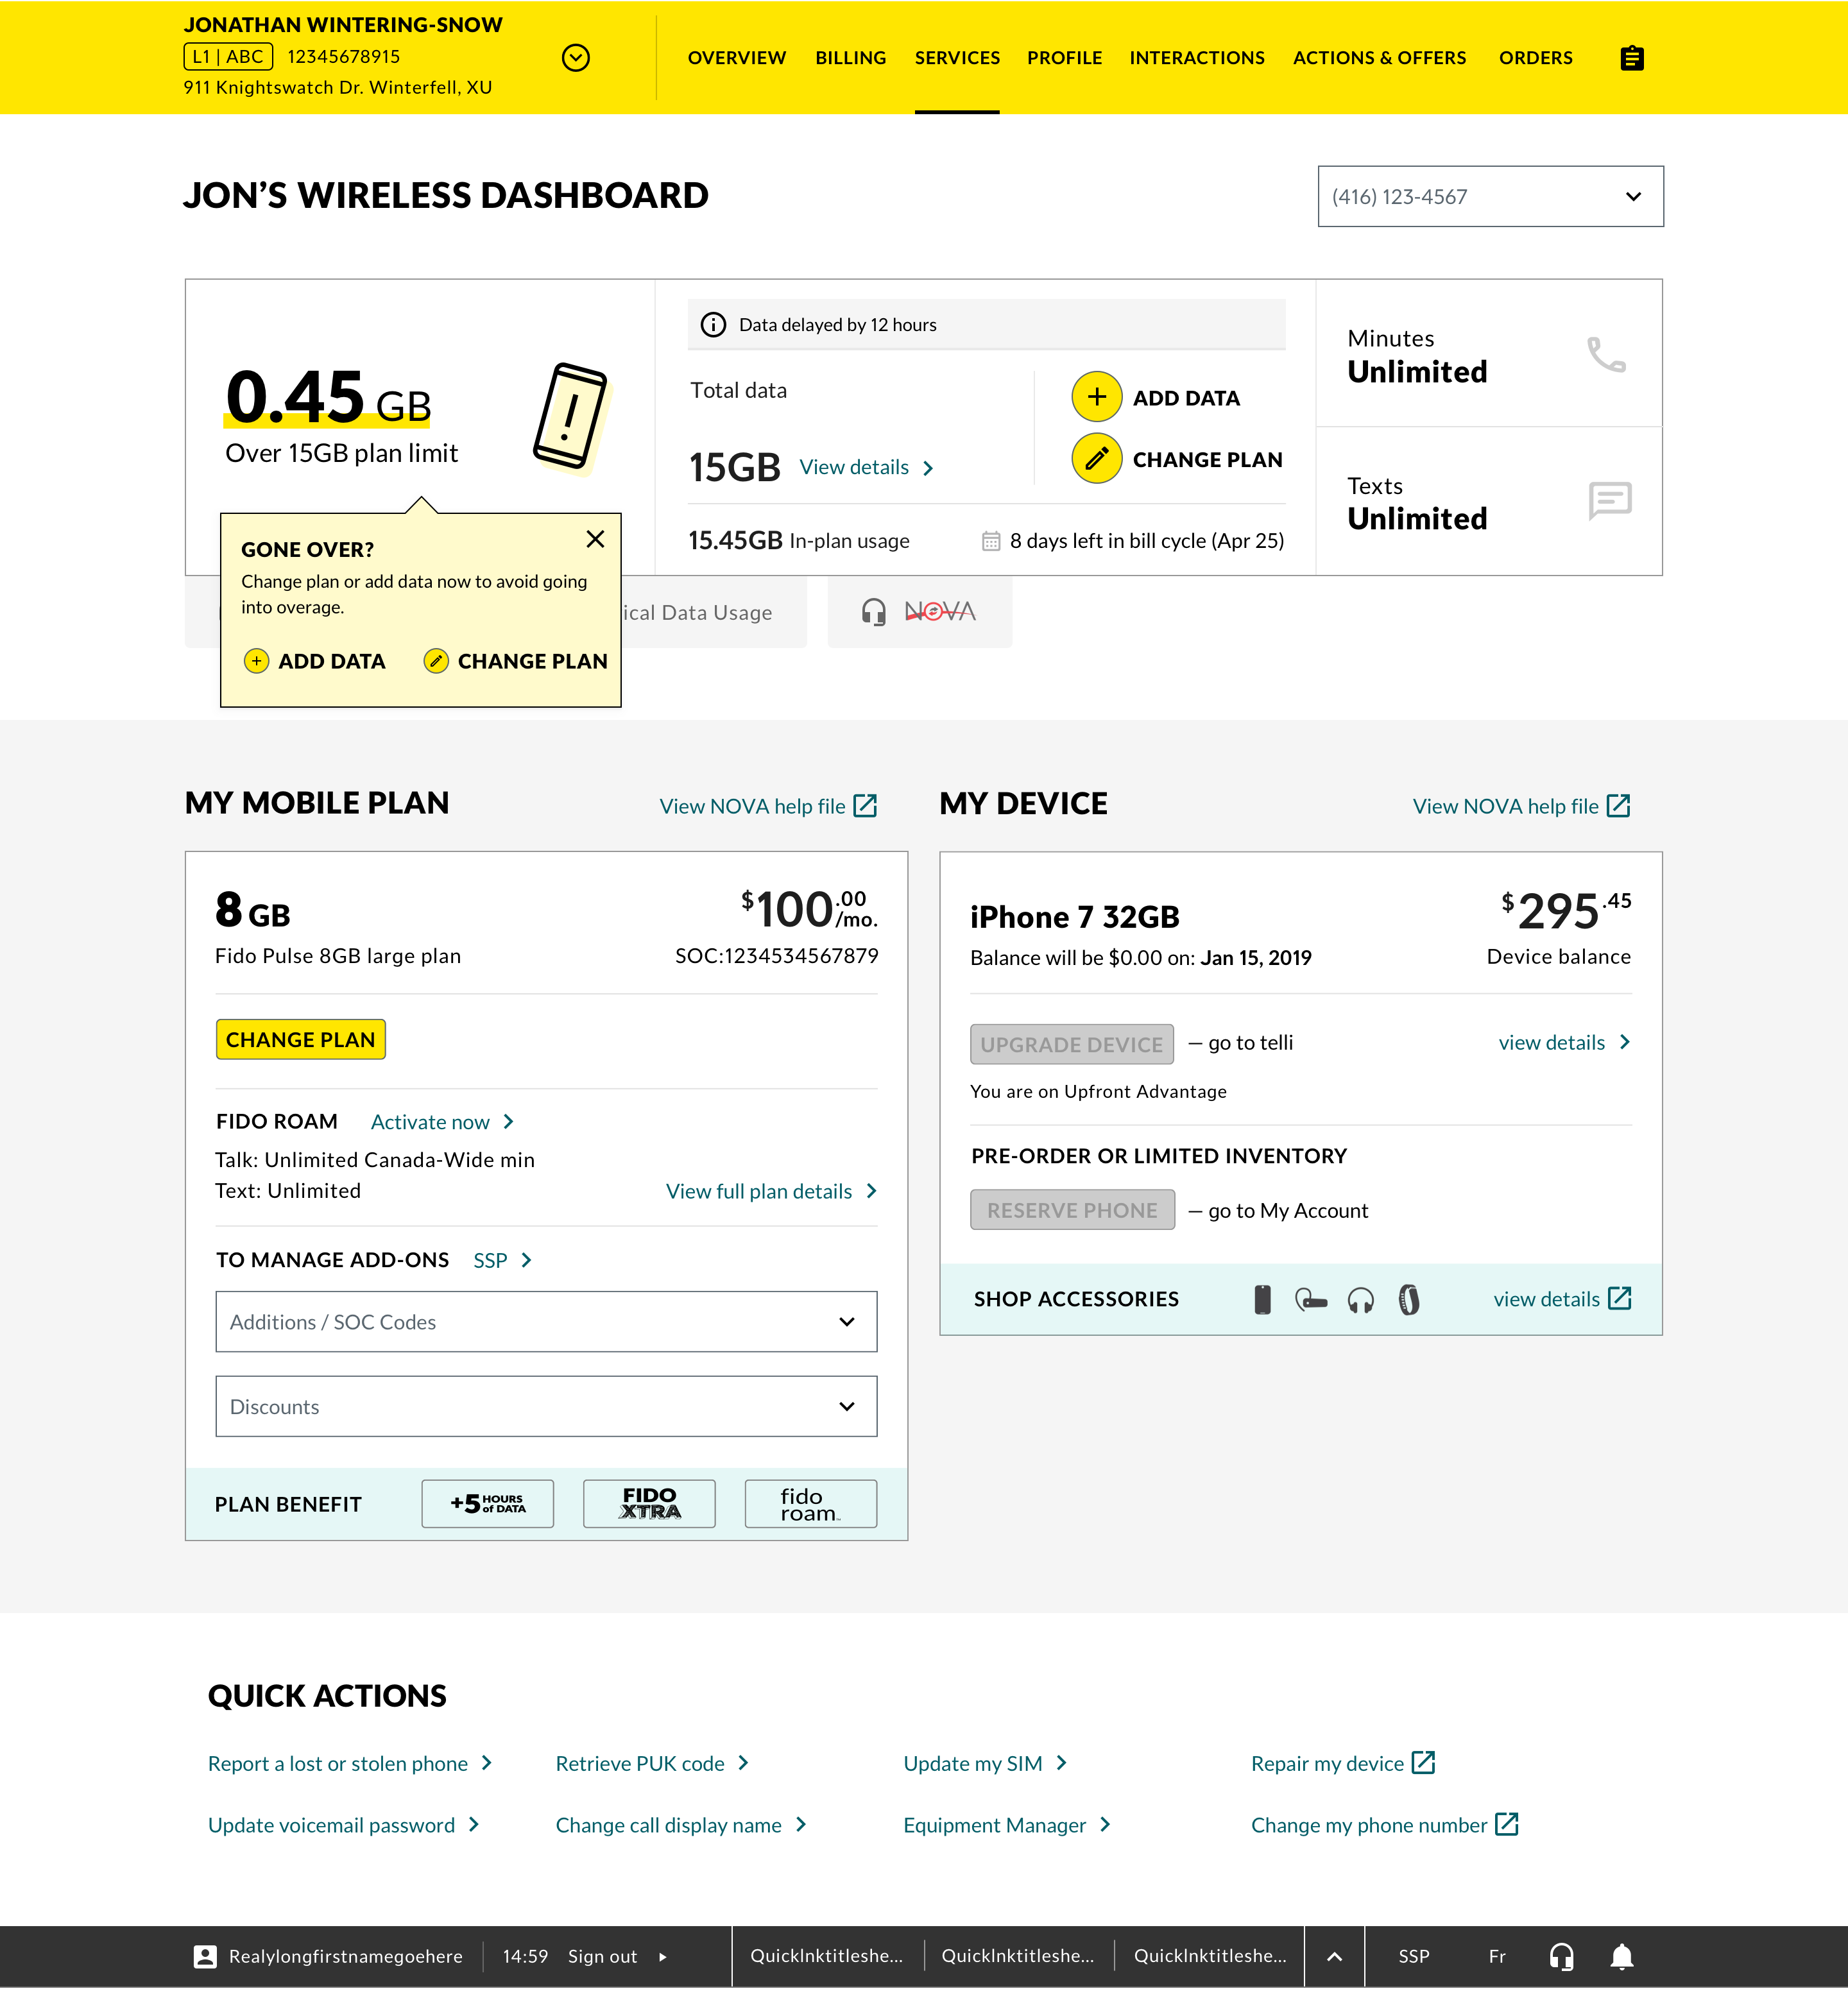
Unhappy paths (data overage, mid-cycle plan changes, adding data) were not properly supported.
Bottom content was hard to discover, despite being logically placed.
The IA structure failed to clearly convey the relationship between family plans, individual lines, and their settings.
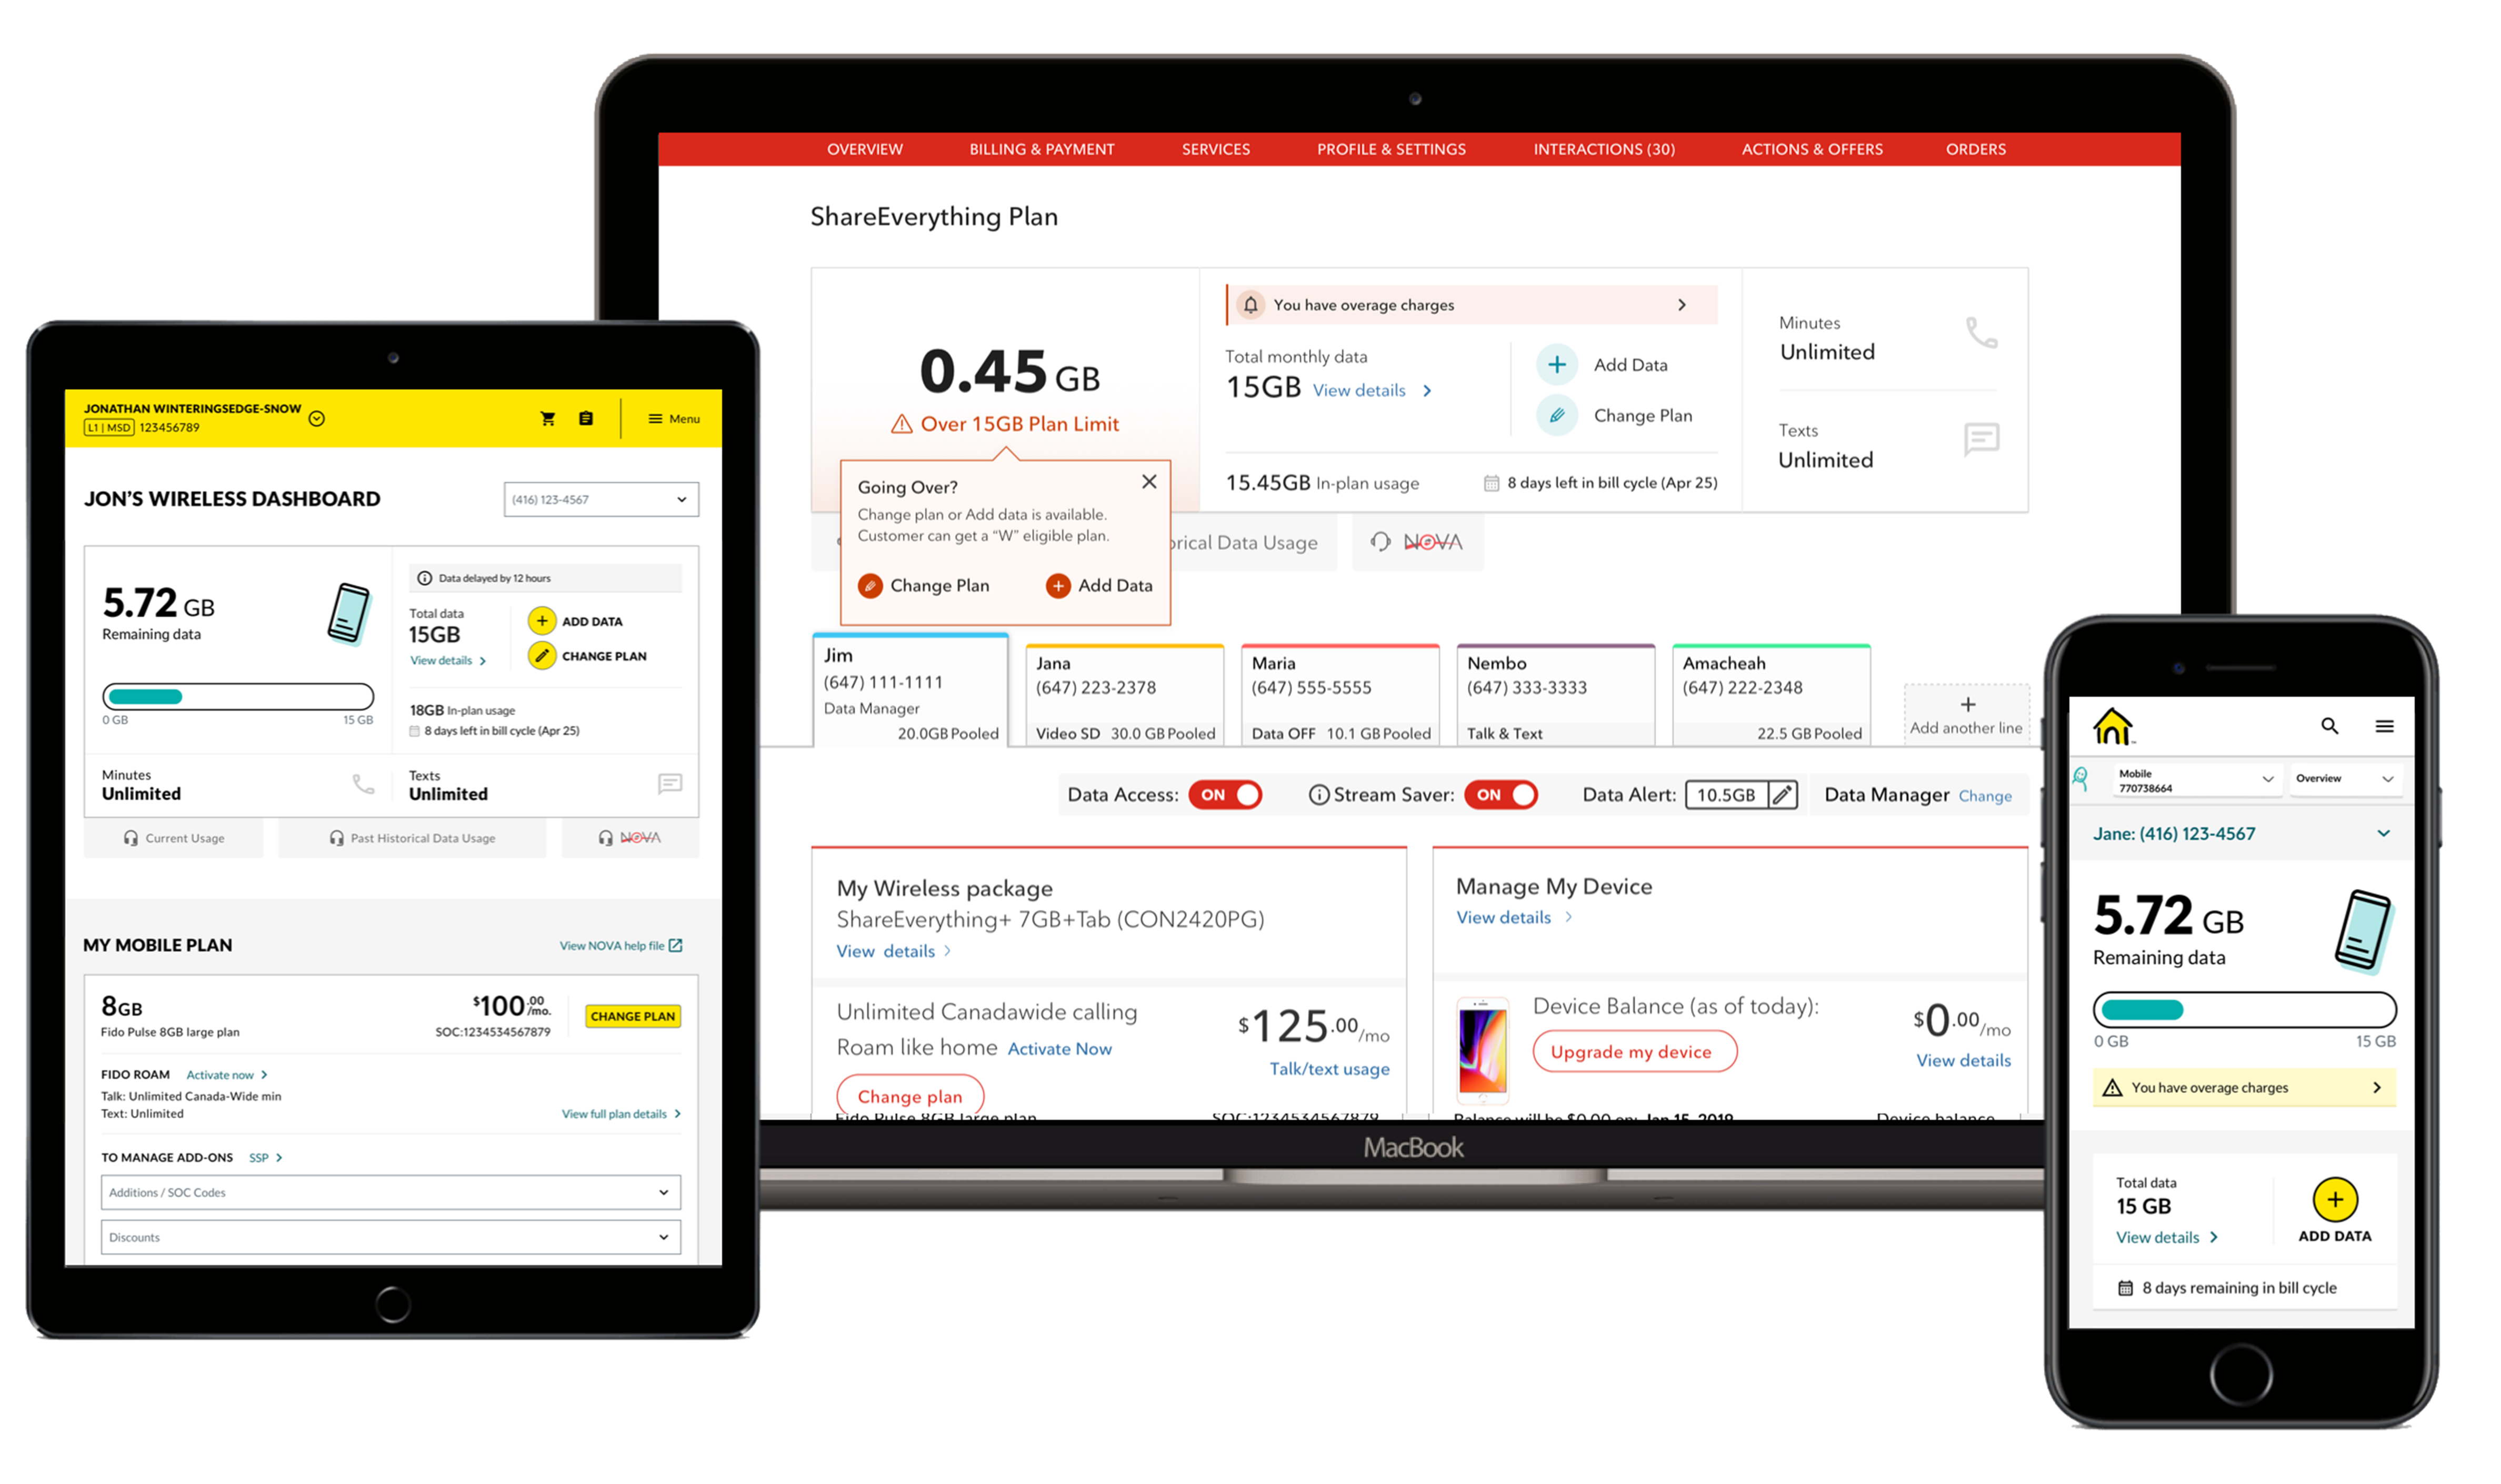
Project Outcome
I led the end-to-end design journey — from the initial scoping discussions, priority alignment with related projects, and customer journey mapping, through to ideation, wireframing, and final mocks.
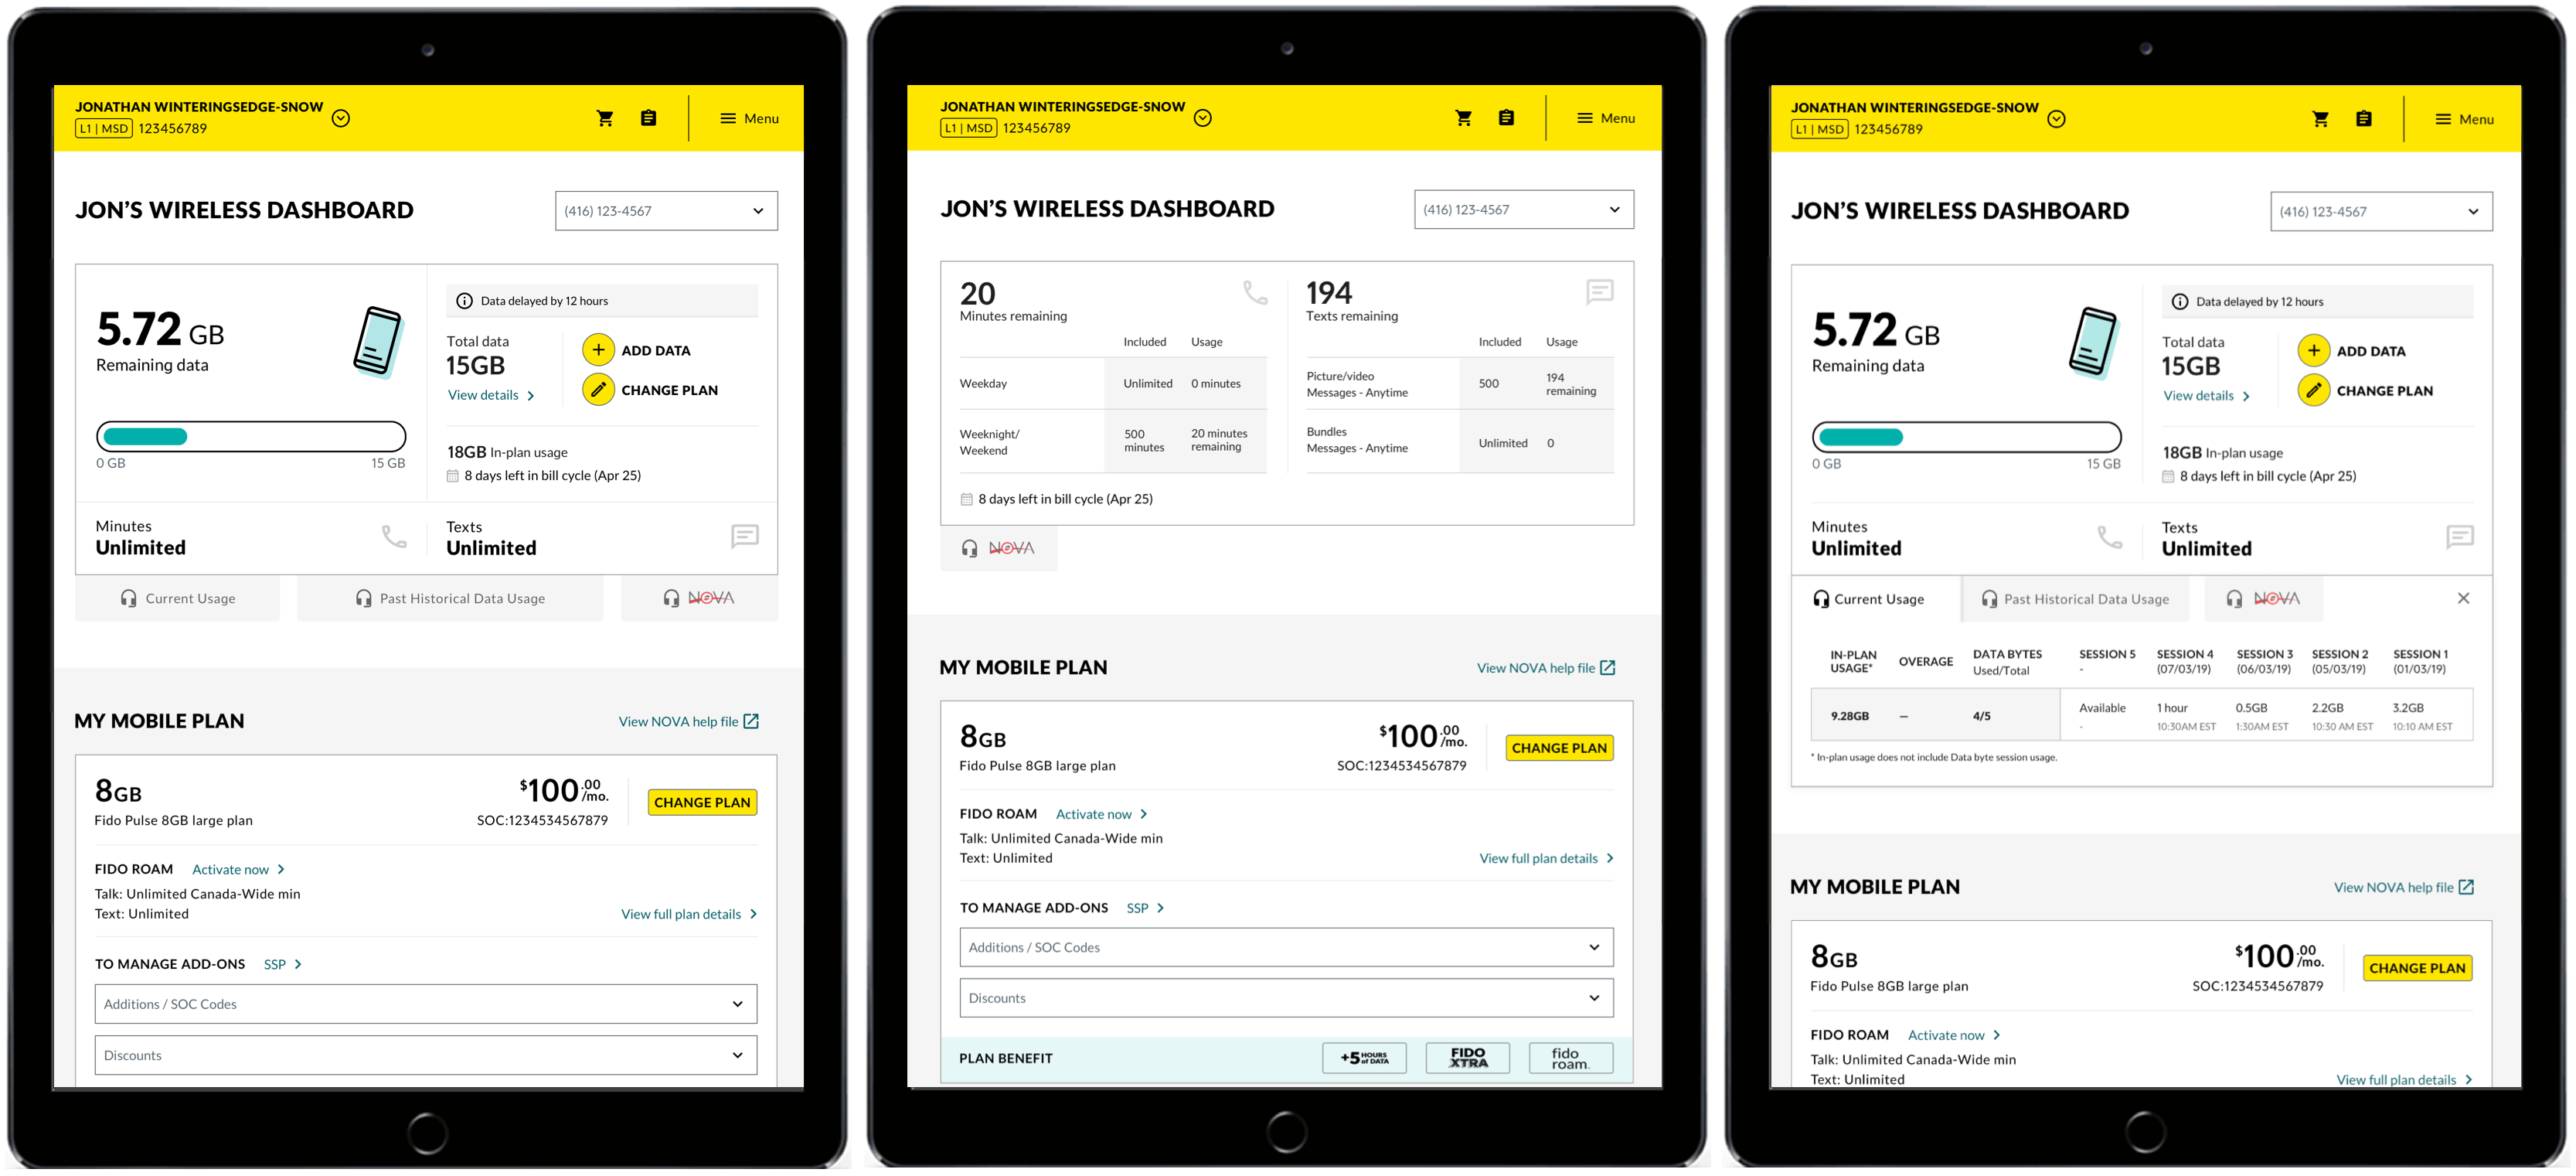
The delivery package includes design solutions for both brands, across multiple channels and device types.
Journey Mapping
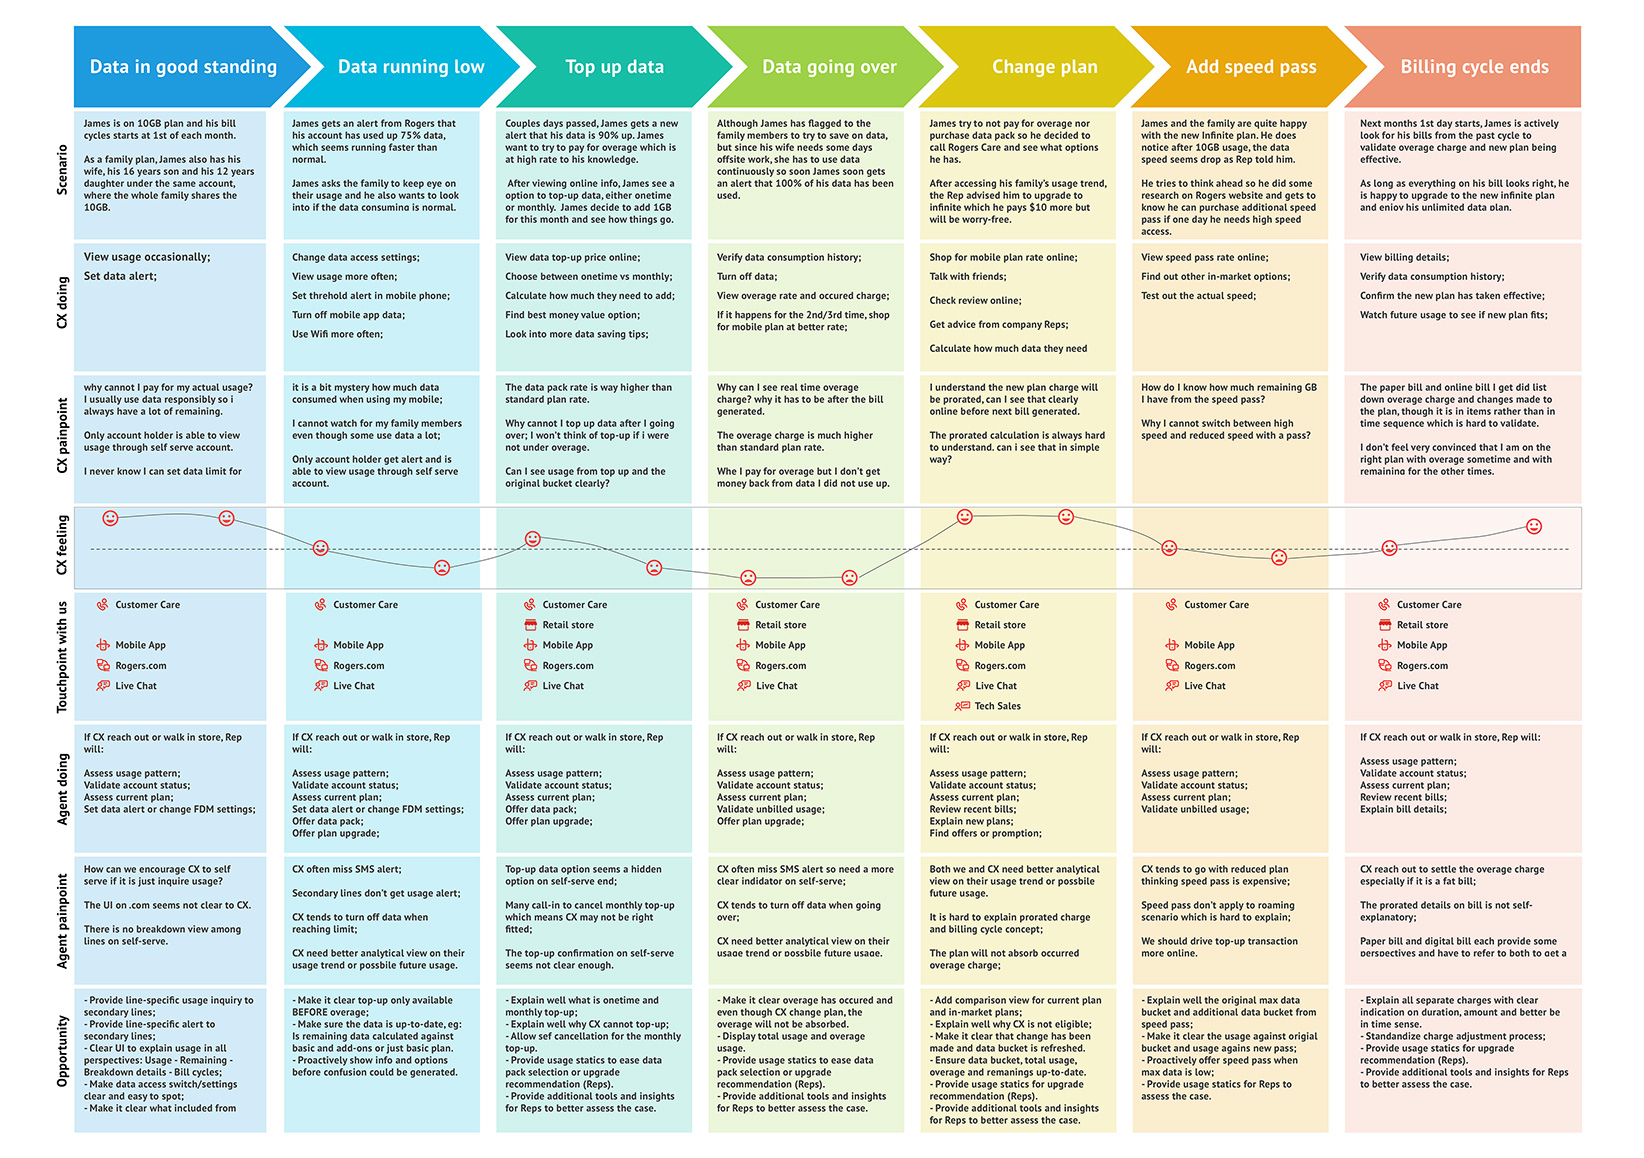
To build a complete picture of the different states customers experience during a billing cycle and to map the behaviors, needs, pain points, and opportunities in each state, I directed the team to create journey maps at the outset of the project.
Page Architecture
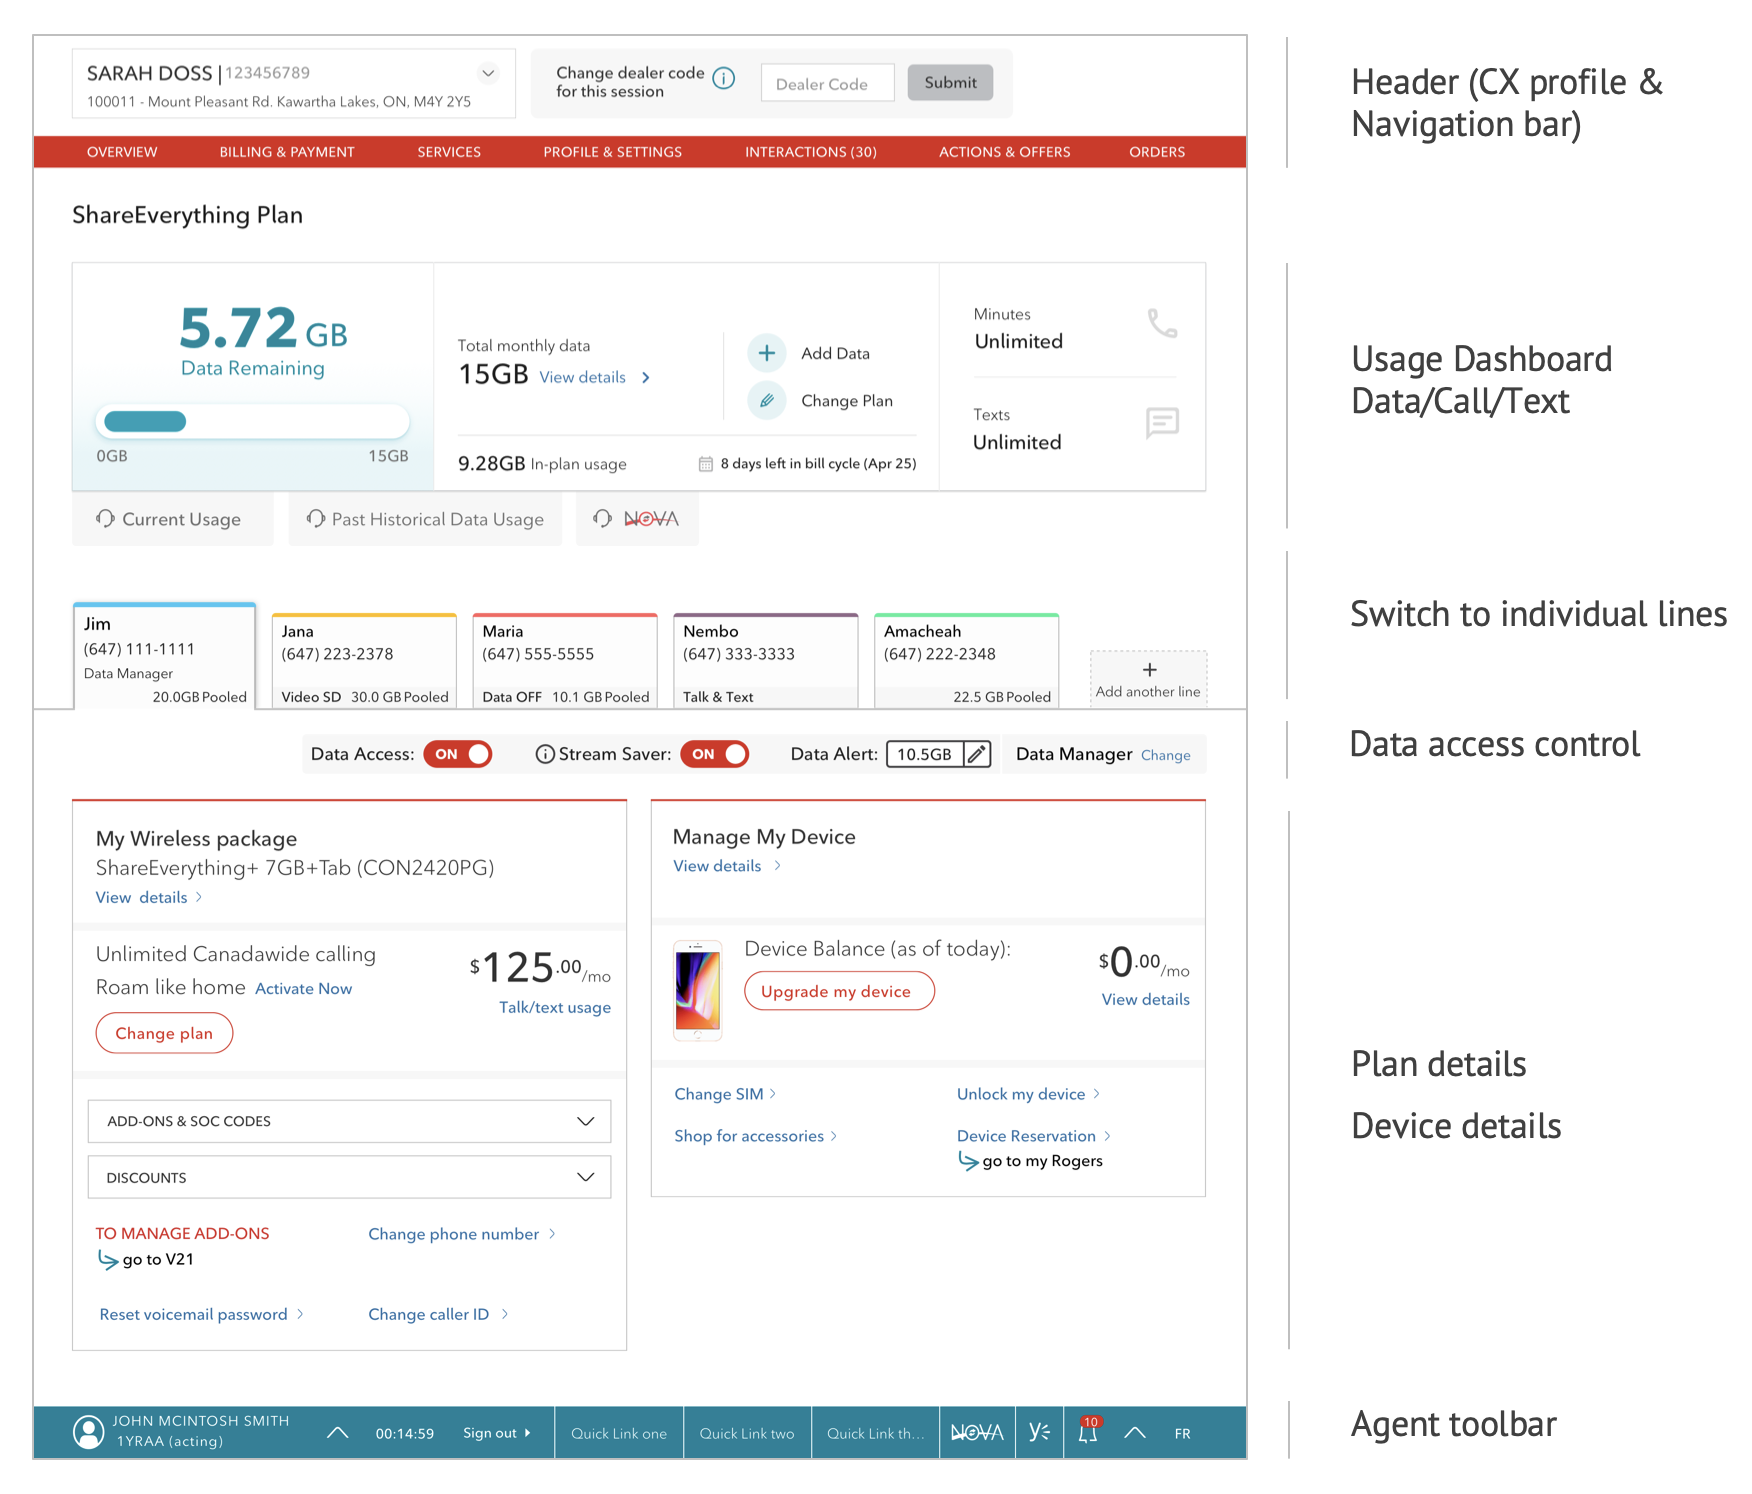
After rounds of journey and use case discussions, I directed the team to create a page architecture that accommodates the following business intentions and product requirements:
Different account statuses and states.
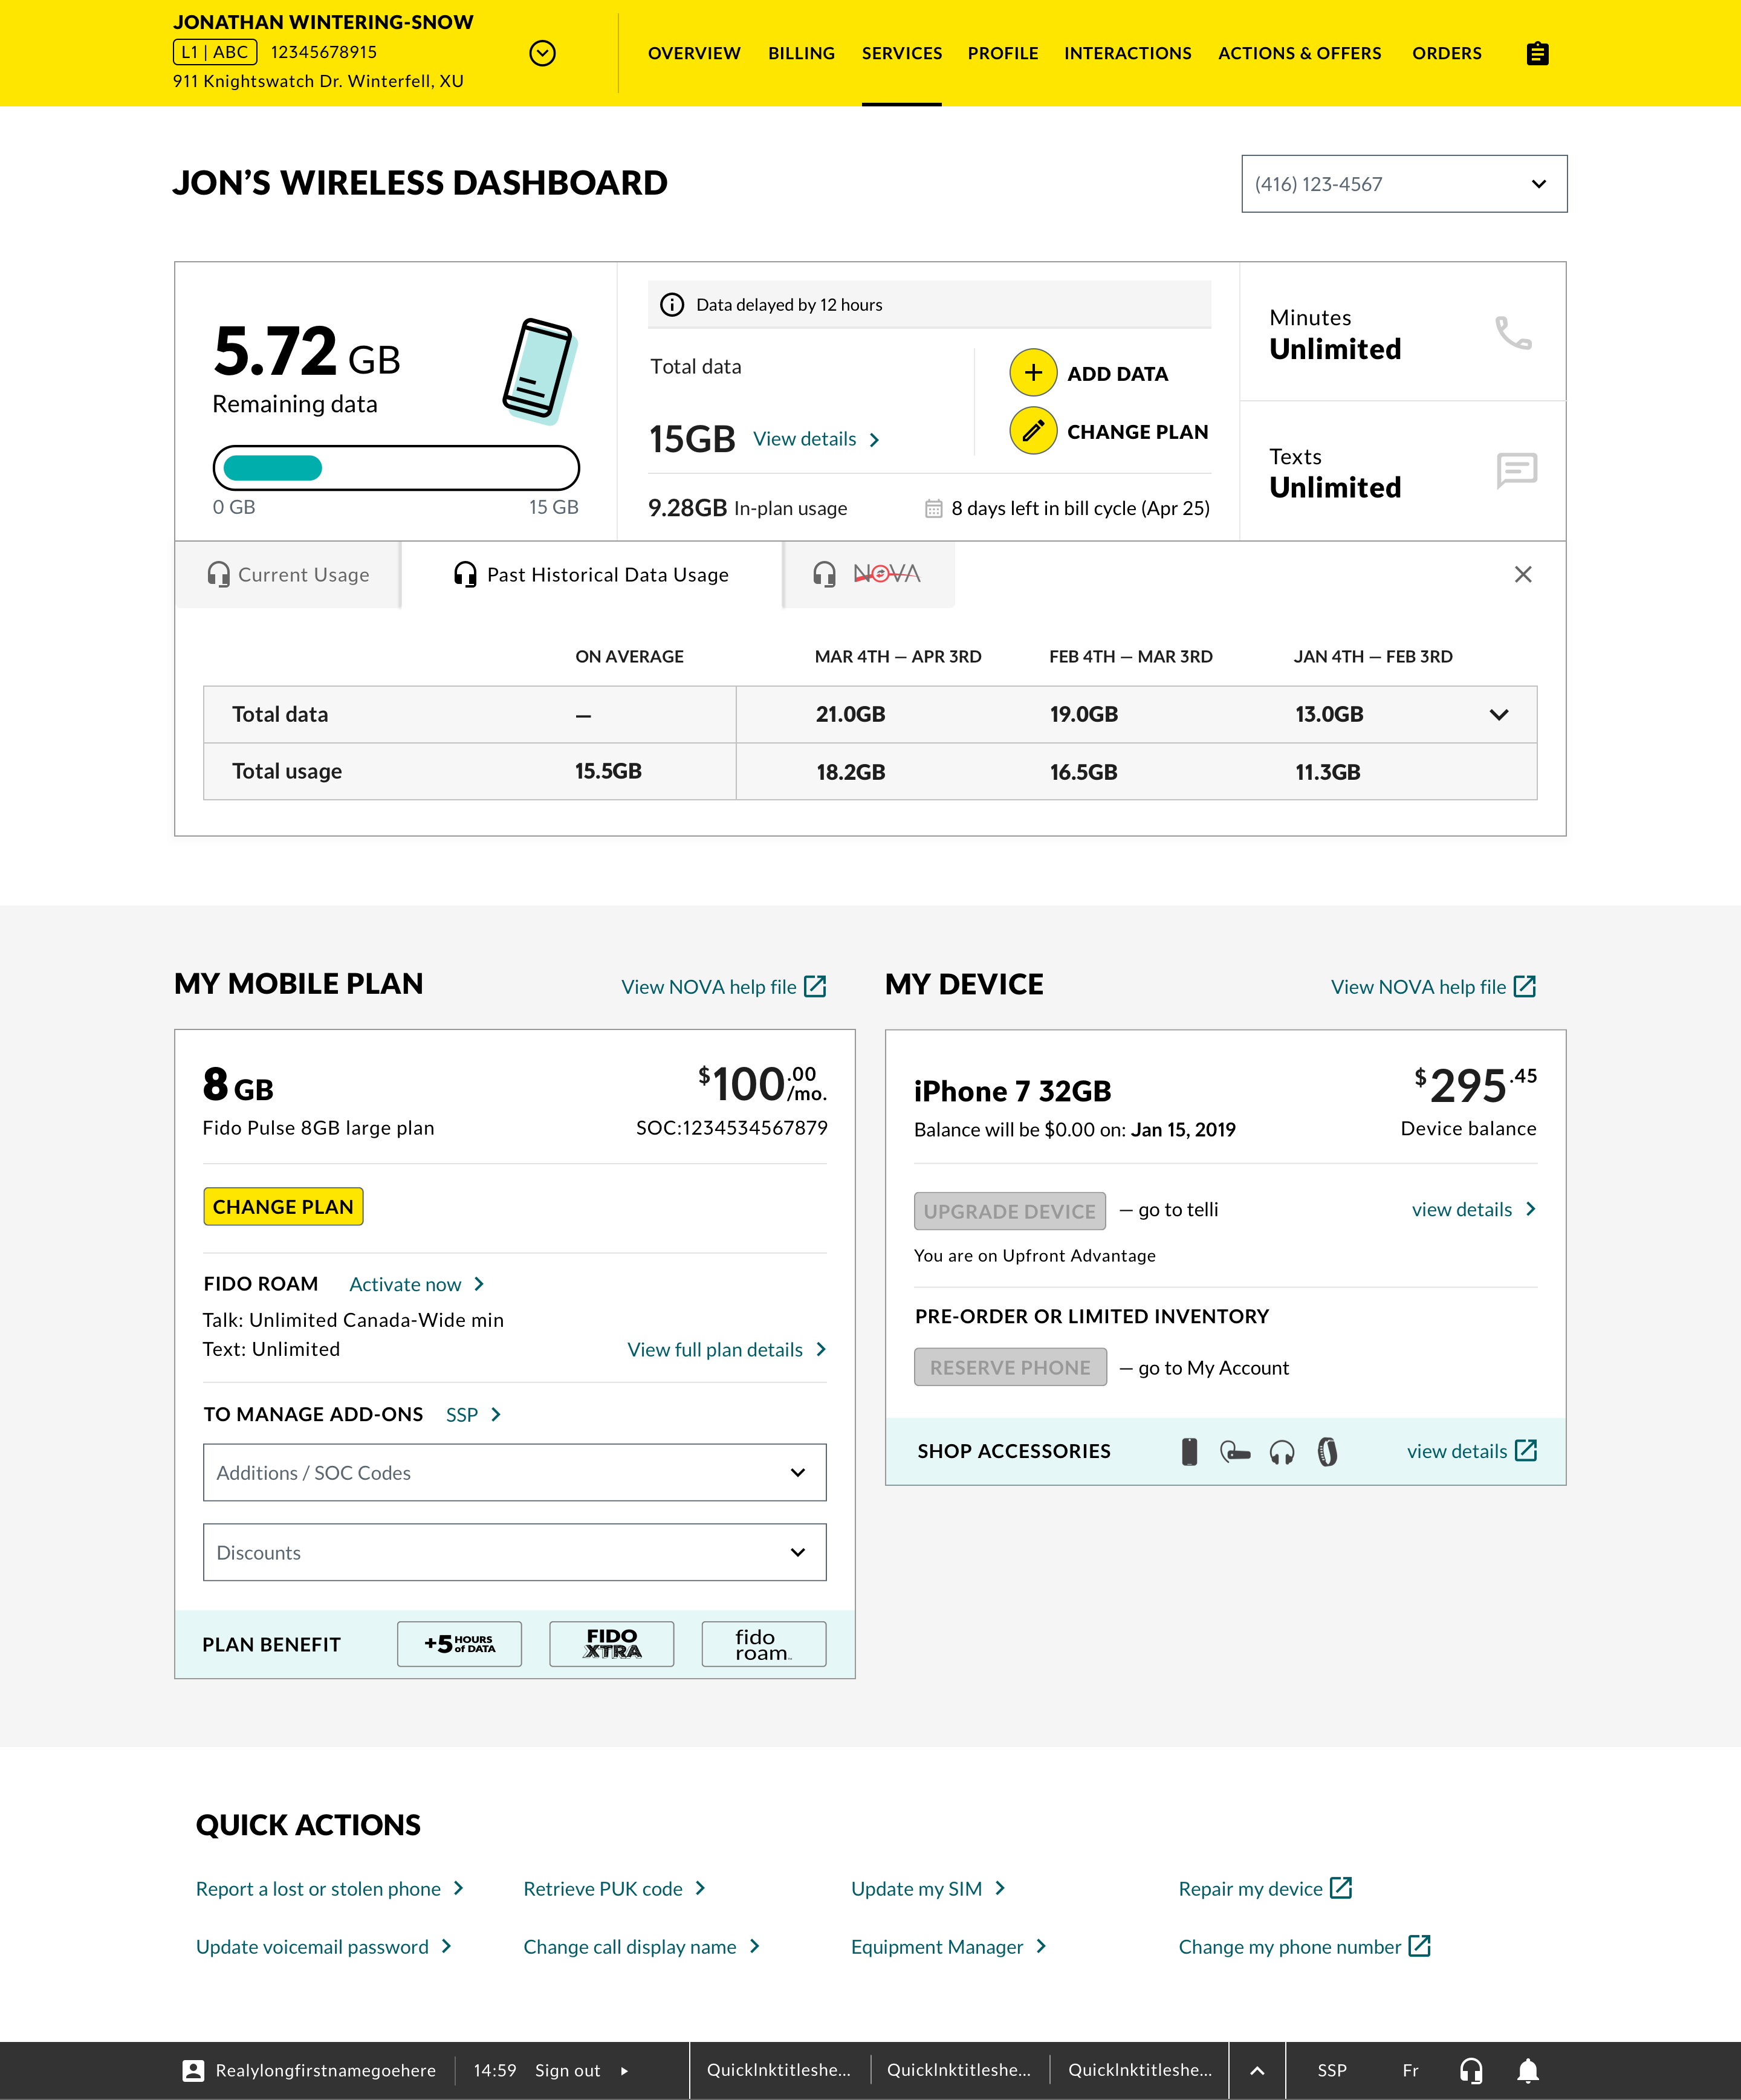
Visibility into both current and historical data.
Separate needs for consumer-facing and agent-facing contexts.
A clear separation between informational and transactional elements.
Wireframe
Interaction Pattern
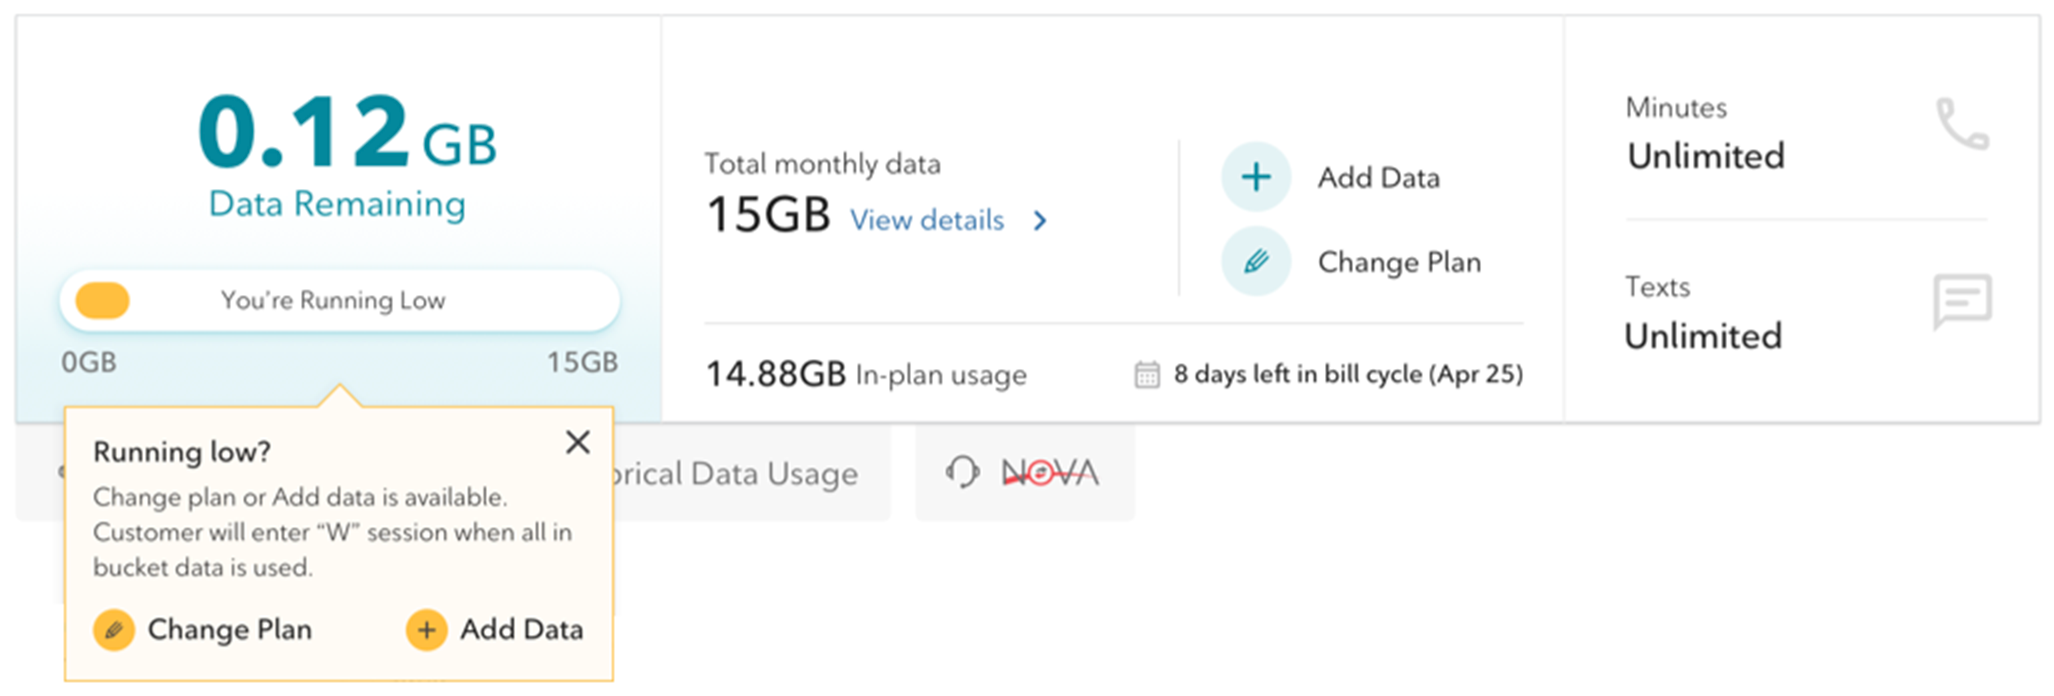
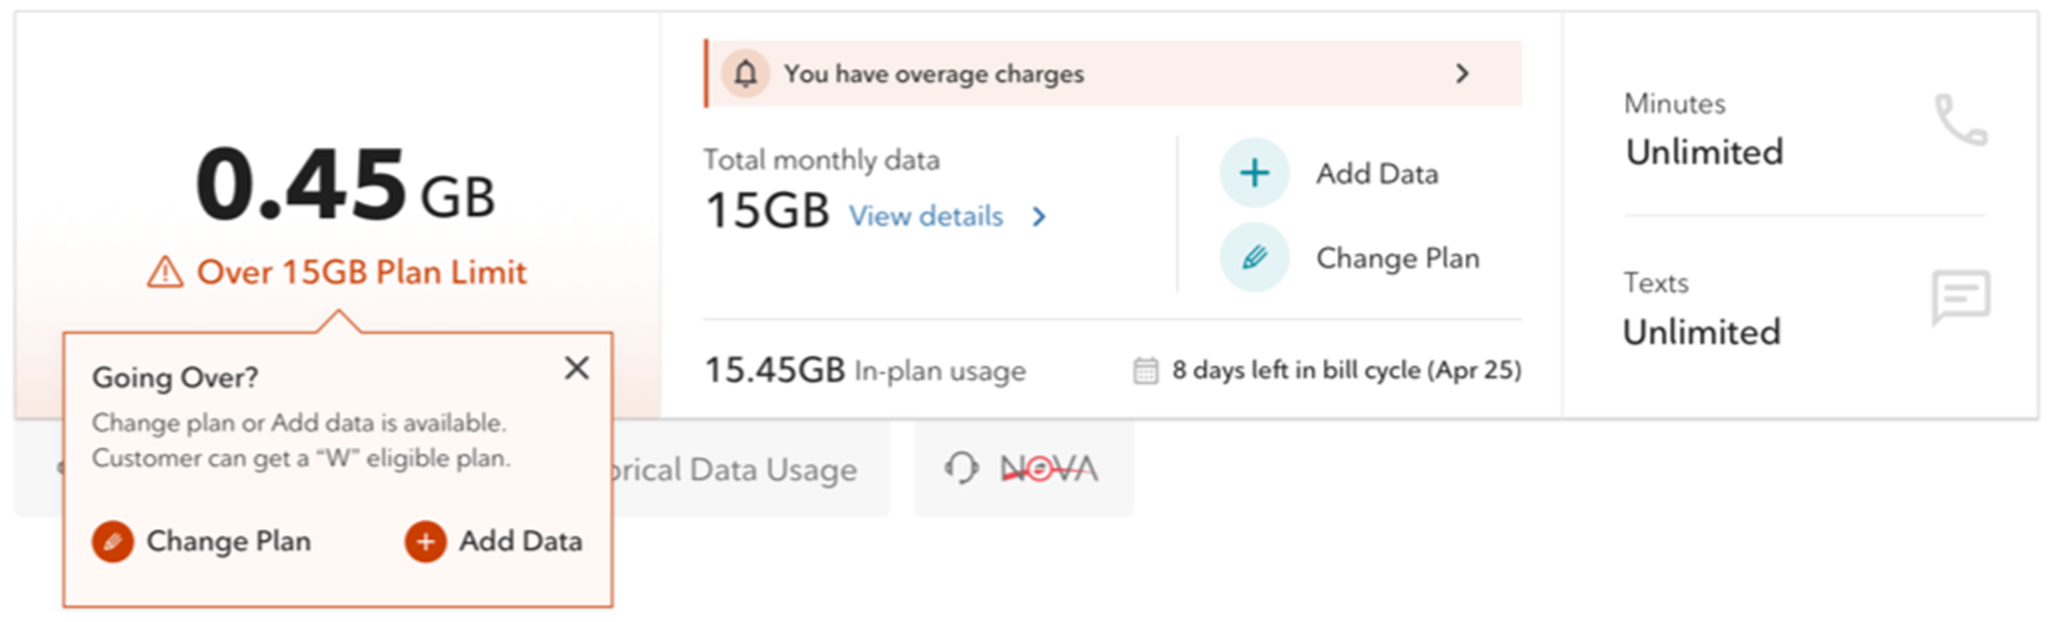
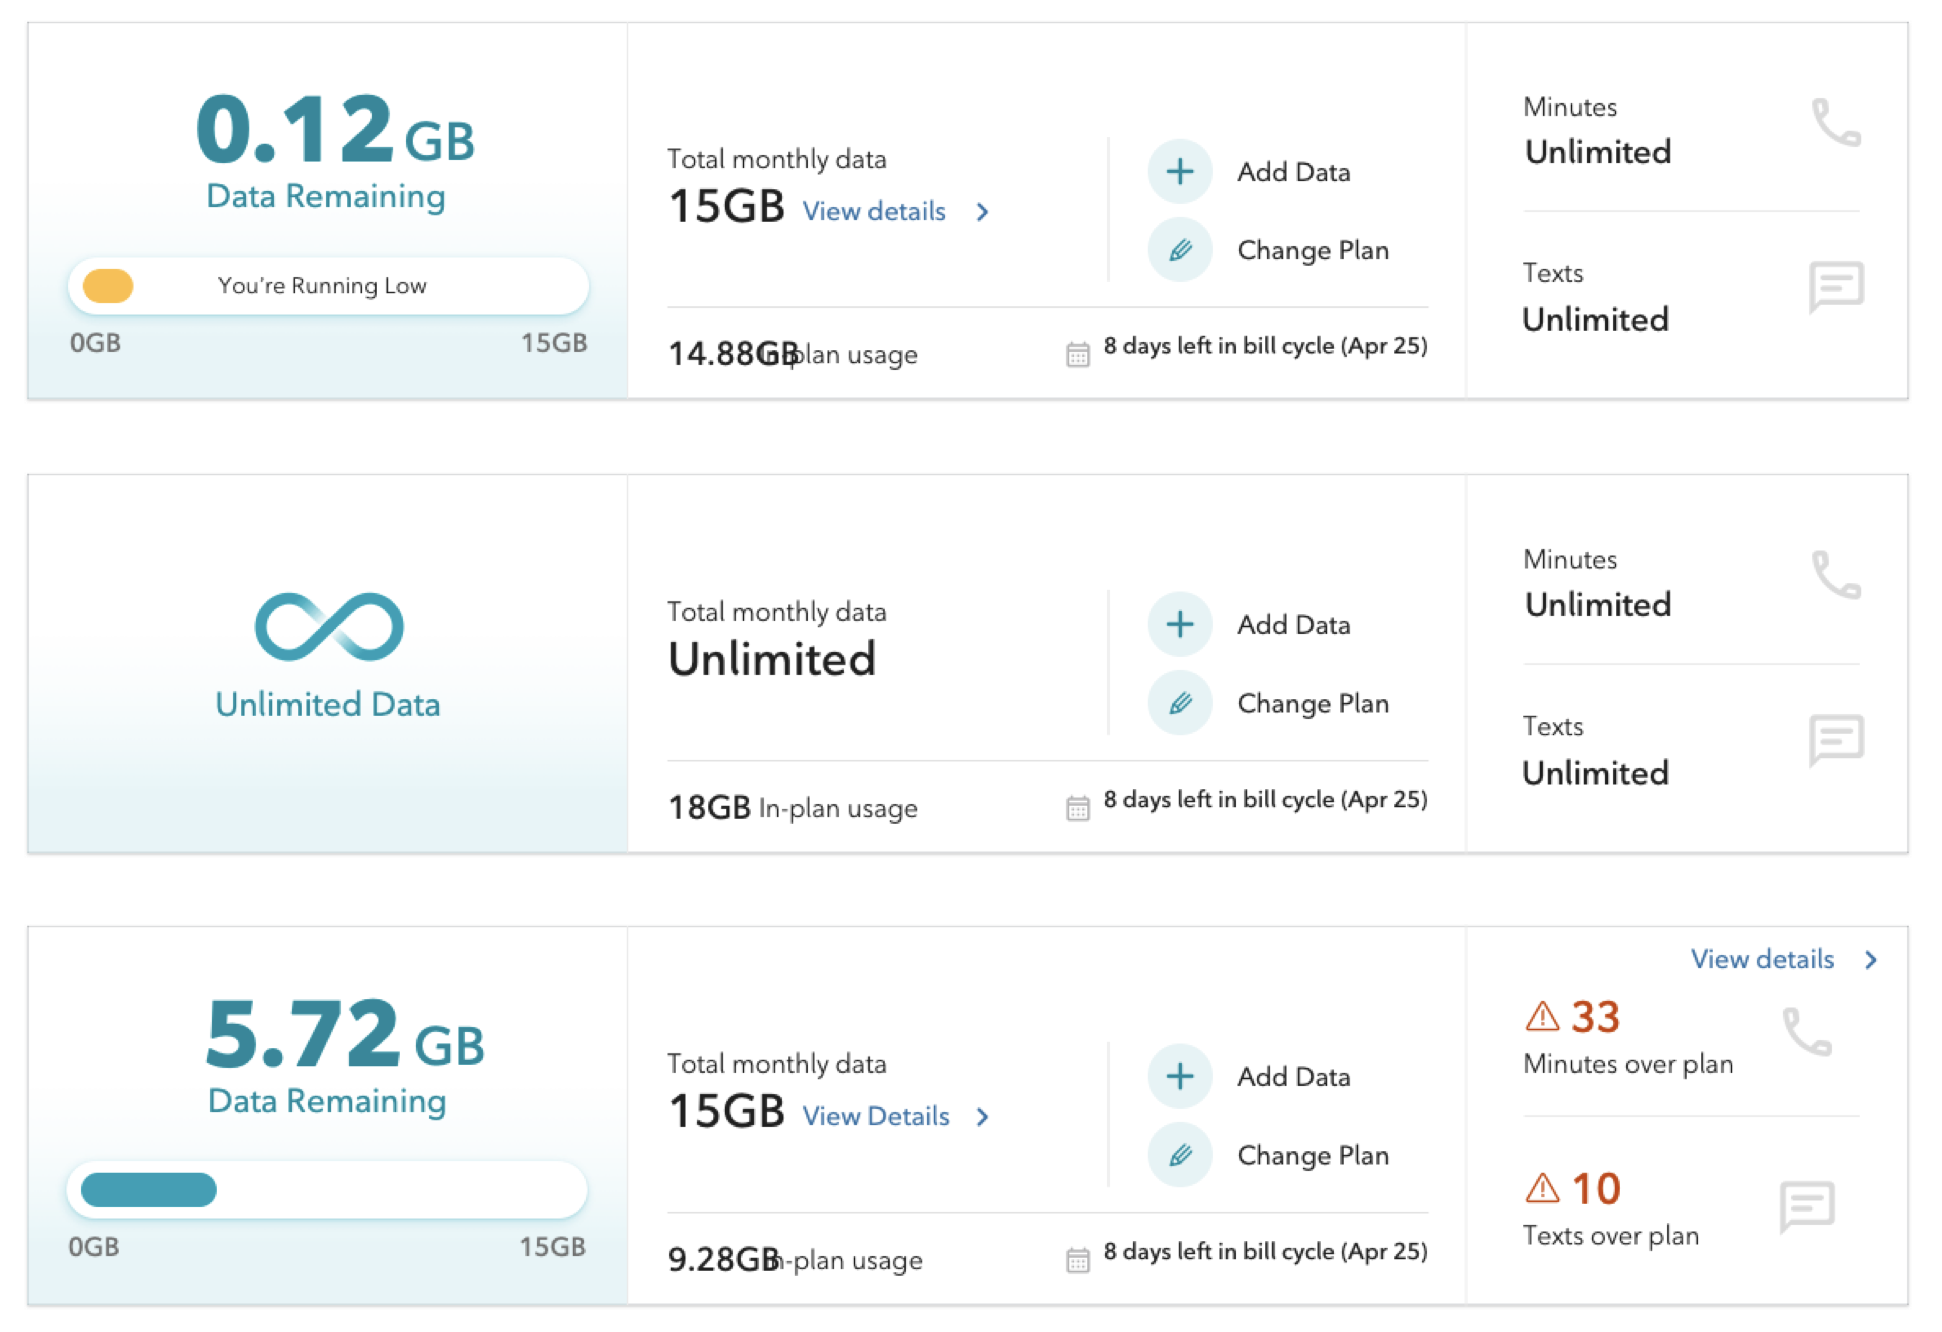
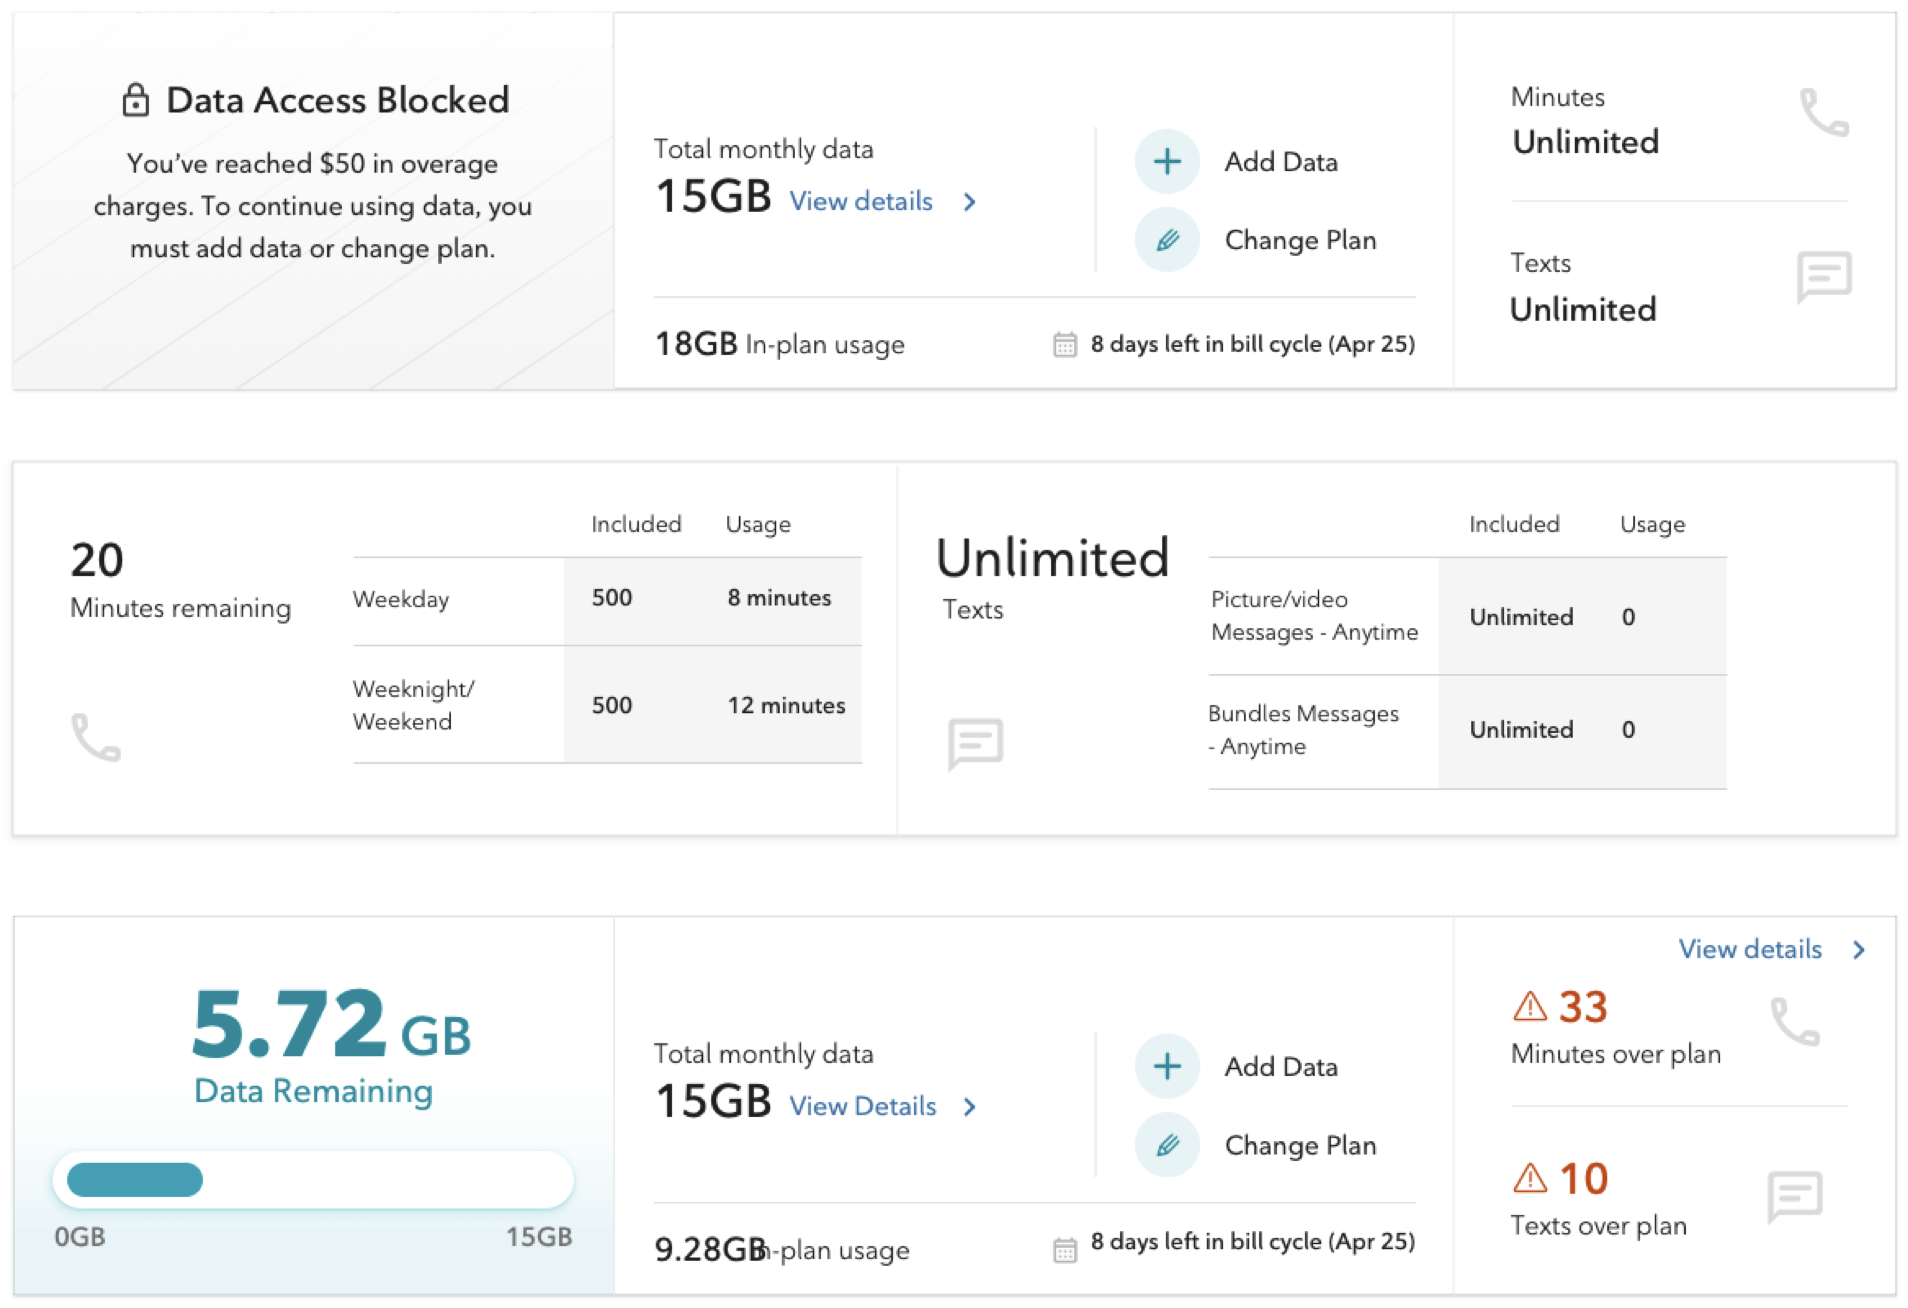
To accommodate different needs and dynamic content within the same dashboard area — and to surface the most relevant information based on context — I guided the team to explore a consistent layering pattern: situational content plus base content, with visual depth used to reflect urgency and reading priority.
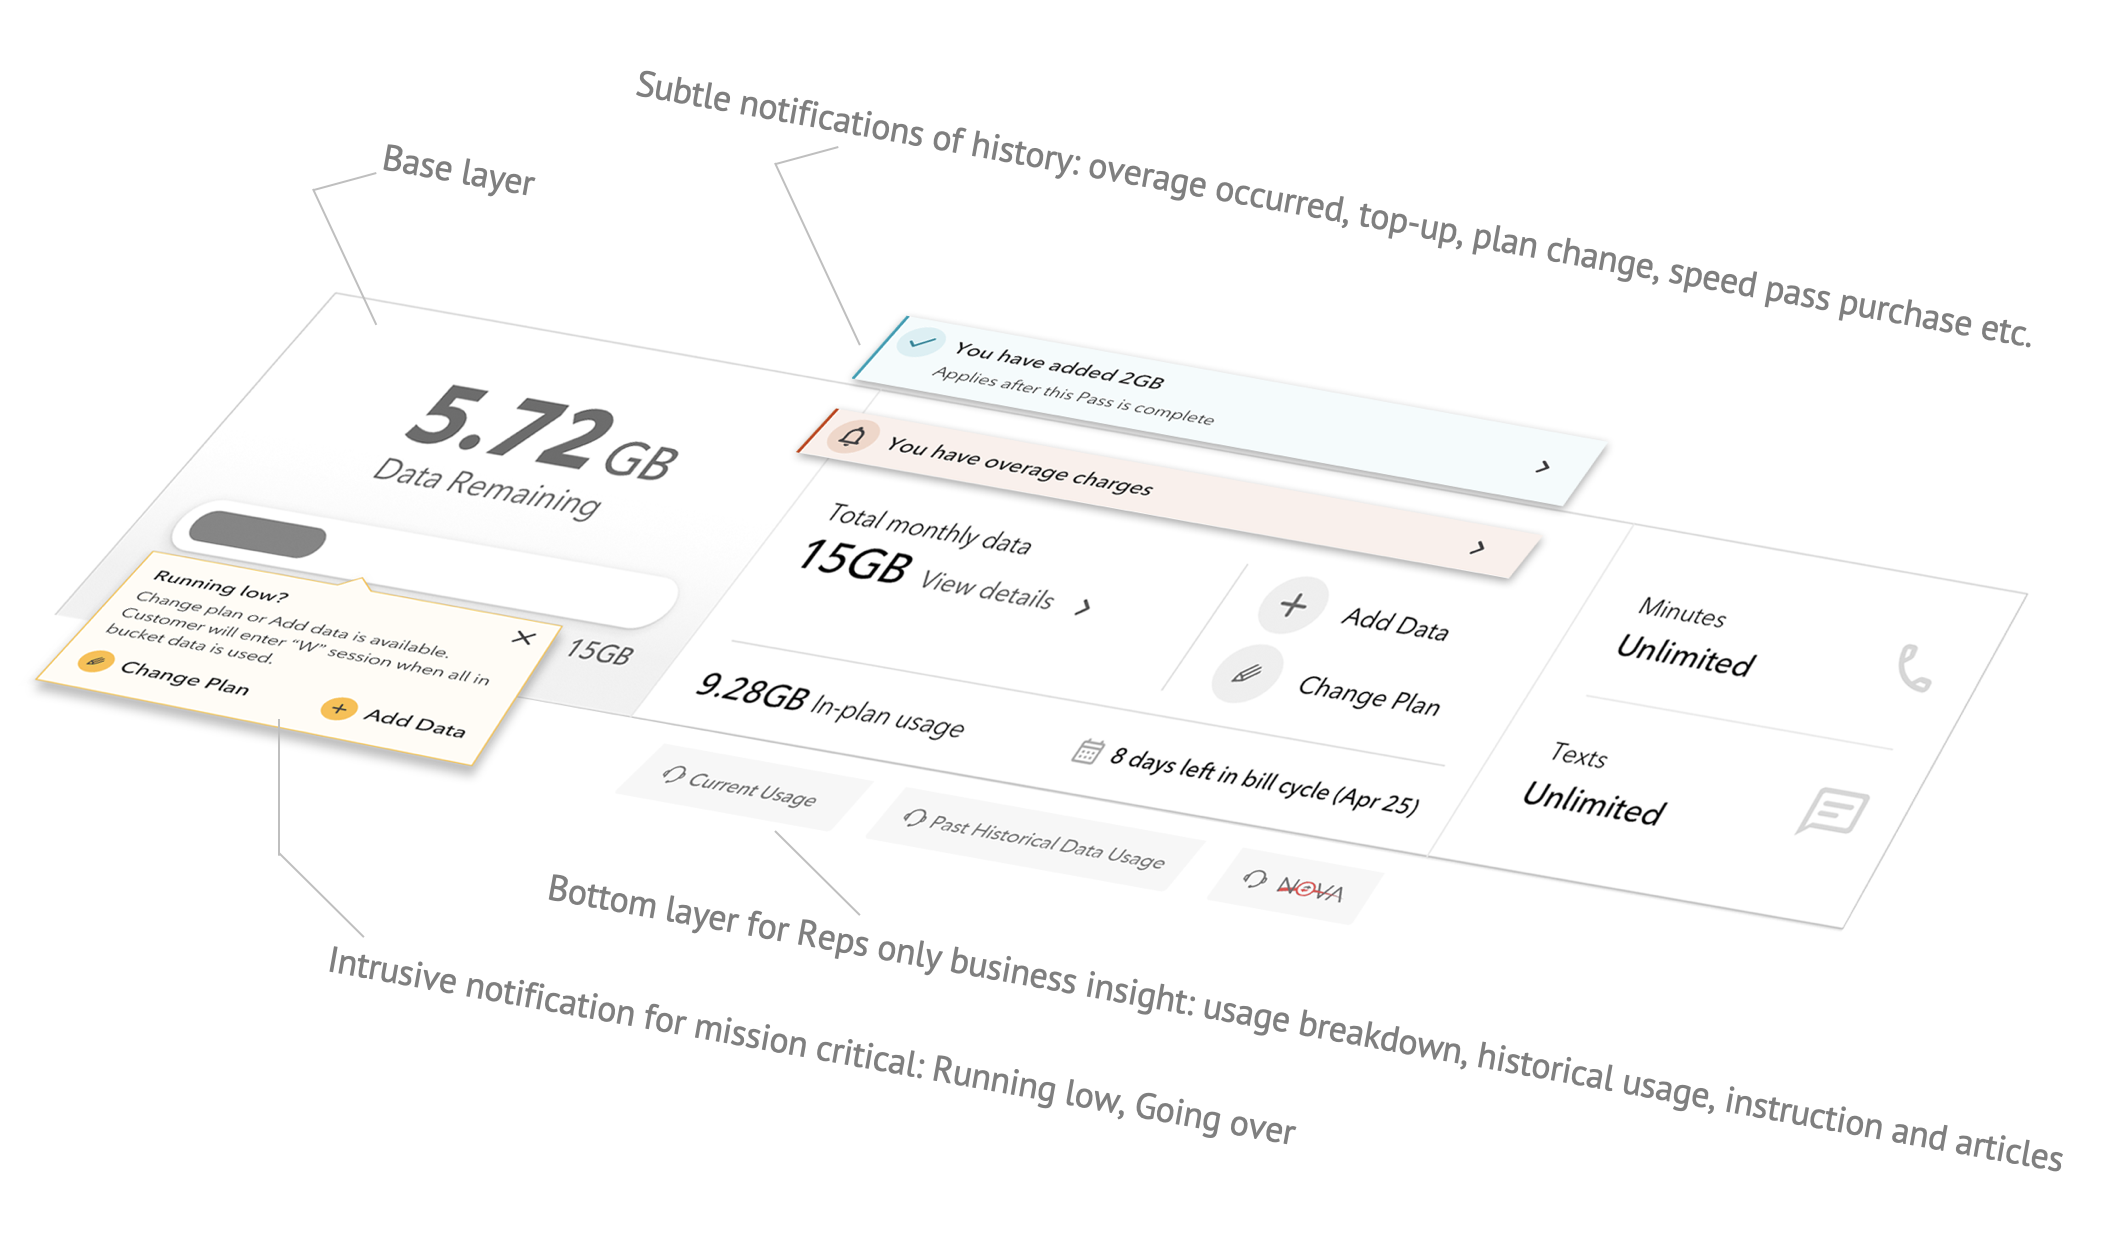
Situational content mapped across different states along the customer journey:
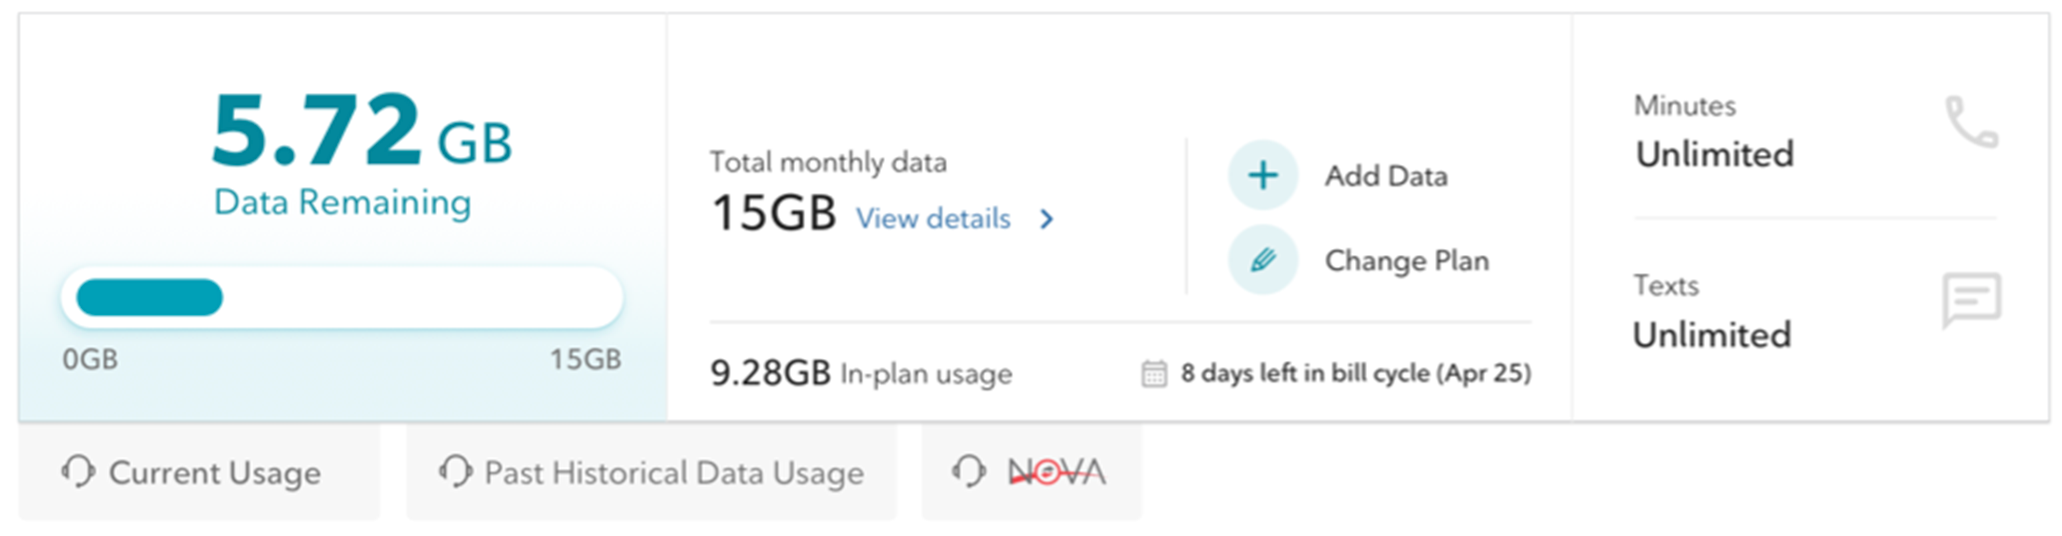
Plus various base layer types covering all account and service configurations:
Create New Component for Agent Insight Display
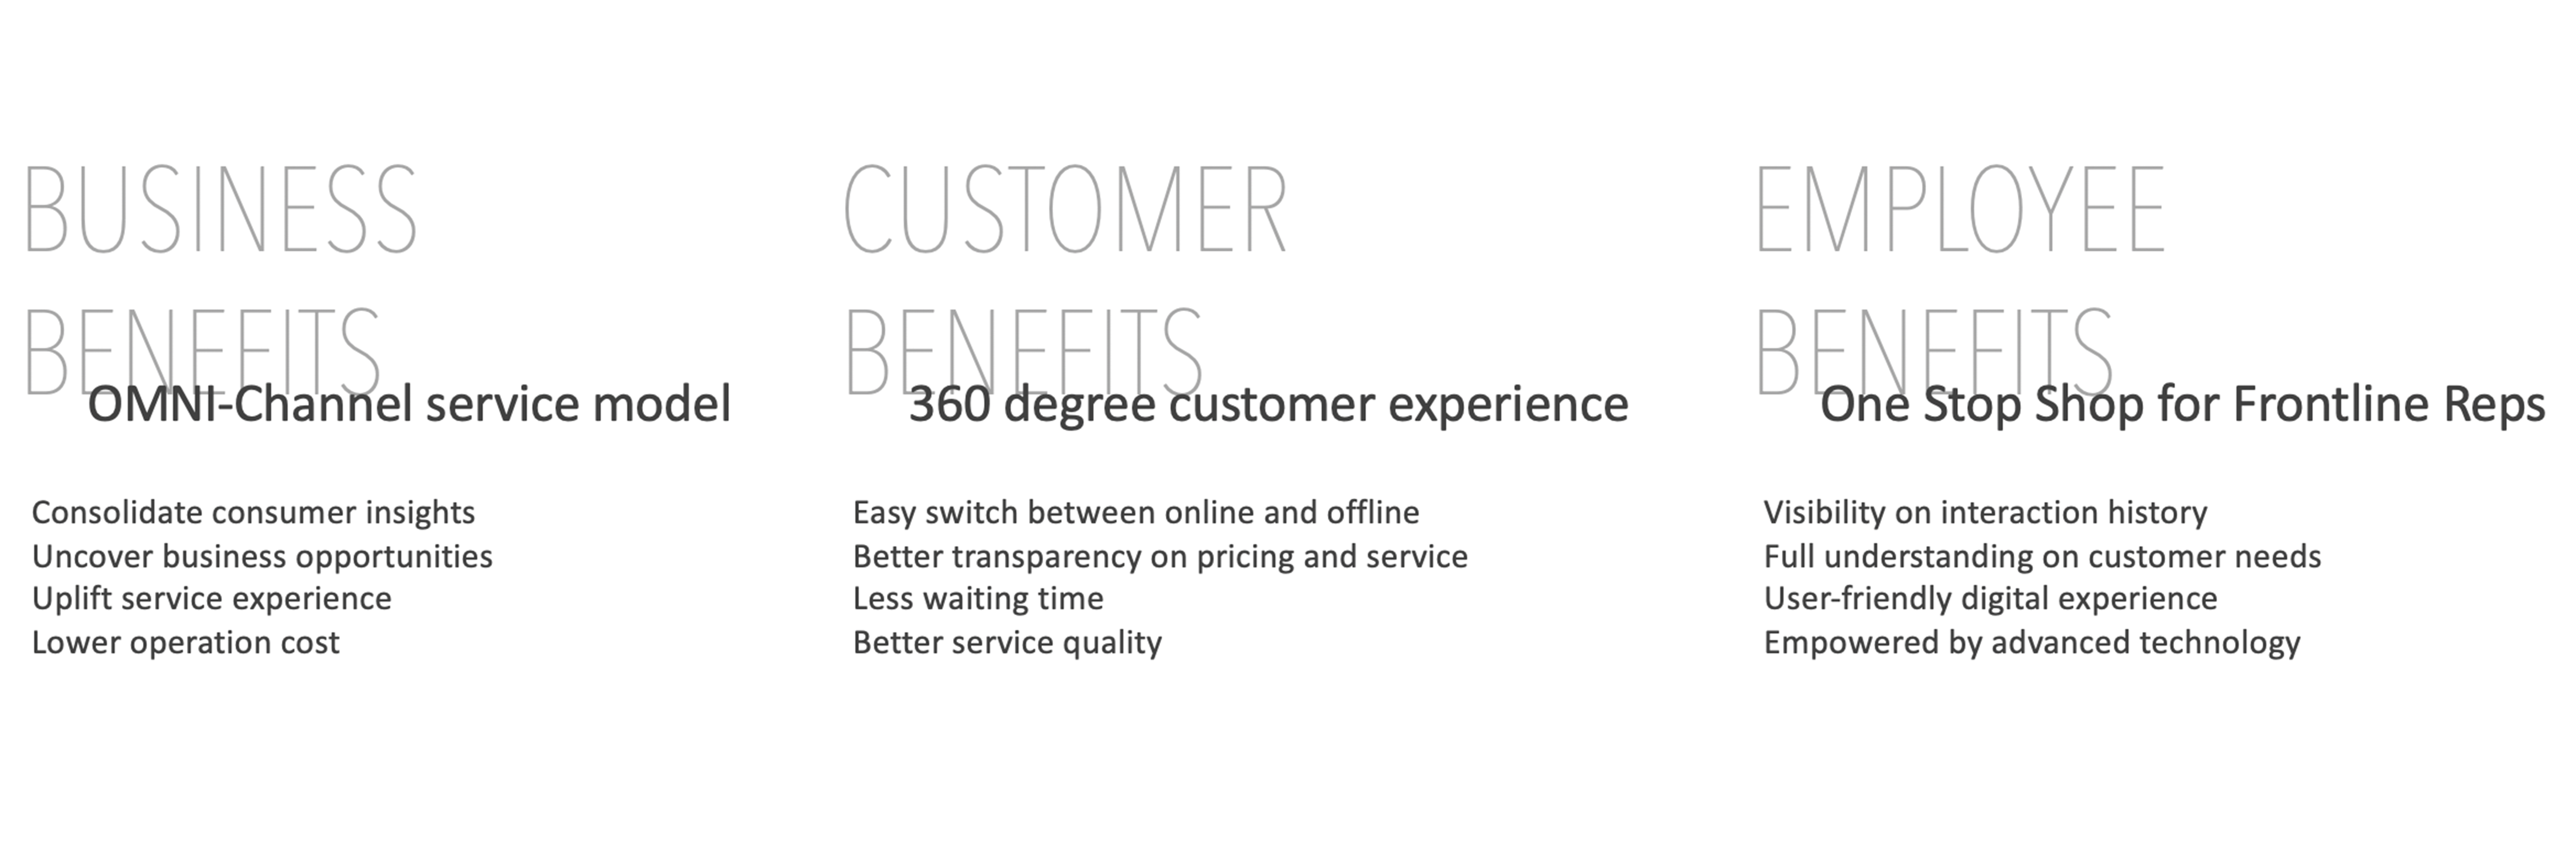
Another major decision I directed was that, as one omni-channel design, the dashboard had to bring synergy between the consumer-facing and Rep-facing versions — so customers can move smoothly between online and offline, and between self-serve and assisted channels, and agents can see exactly what a customer is looking at when they reach out. All of this tied directly back to the product vision we set as a product development team.
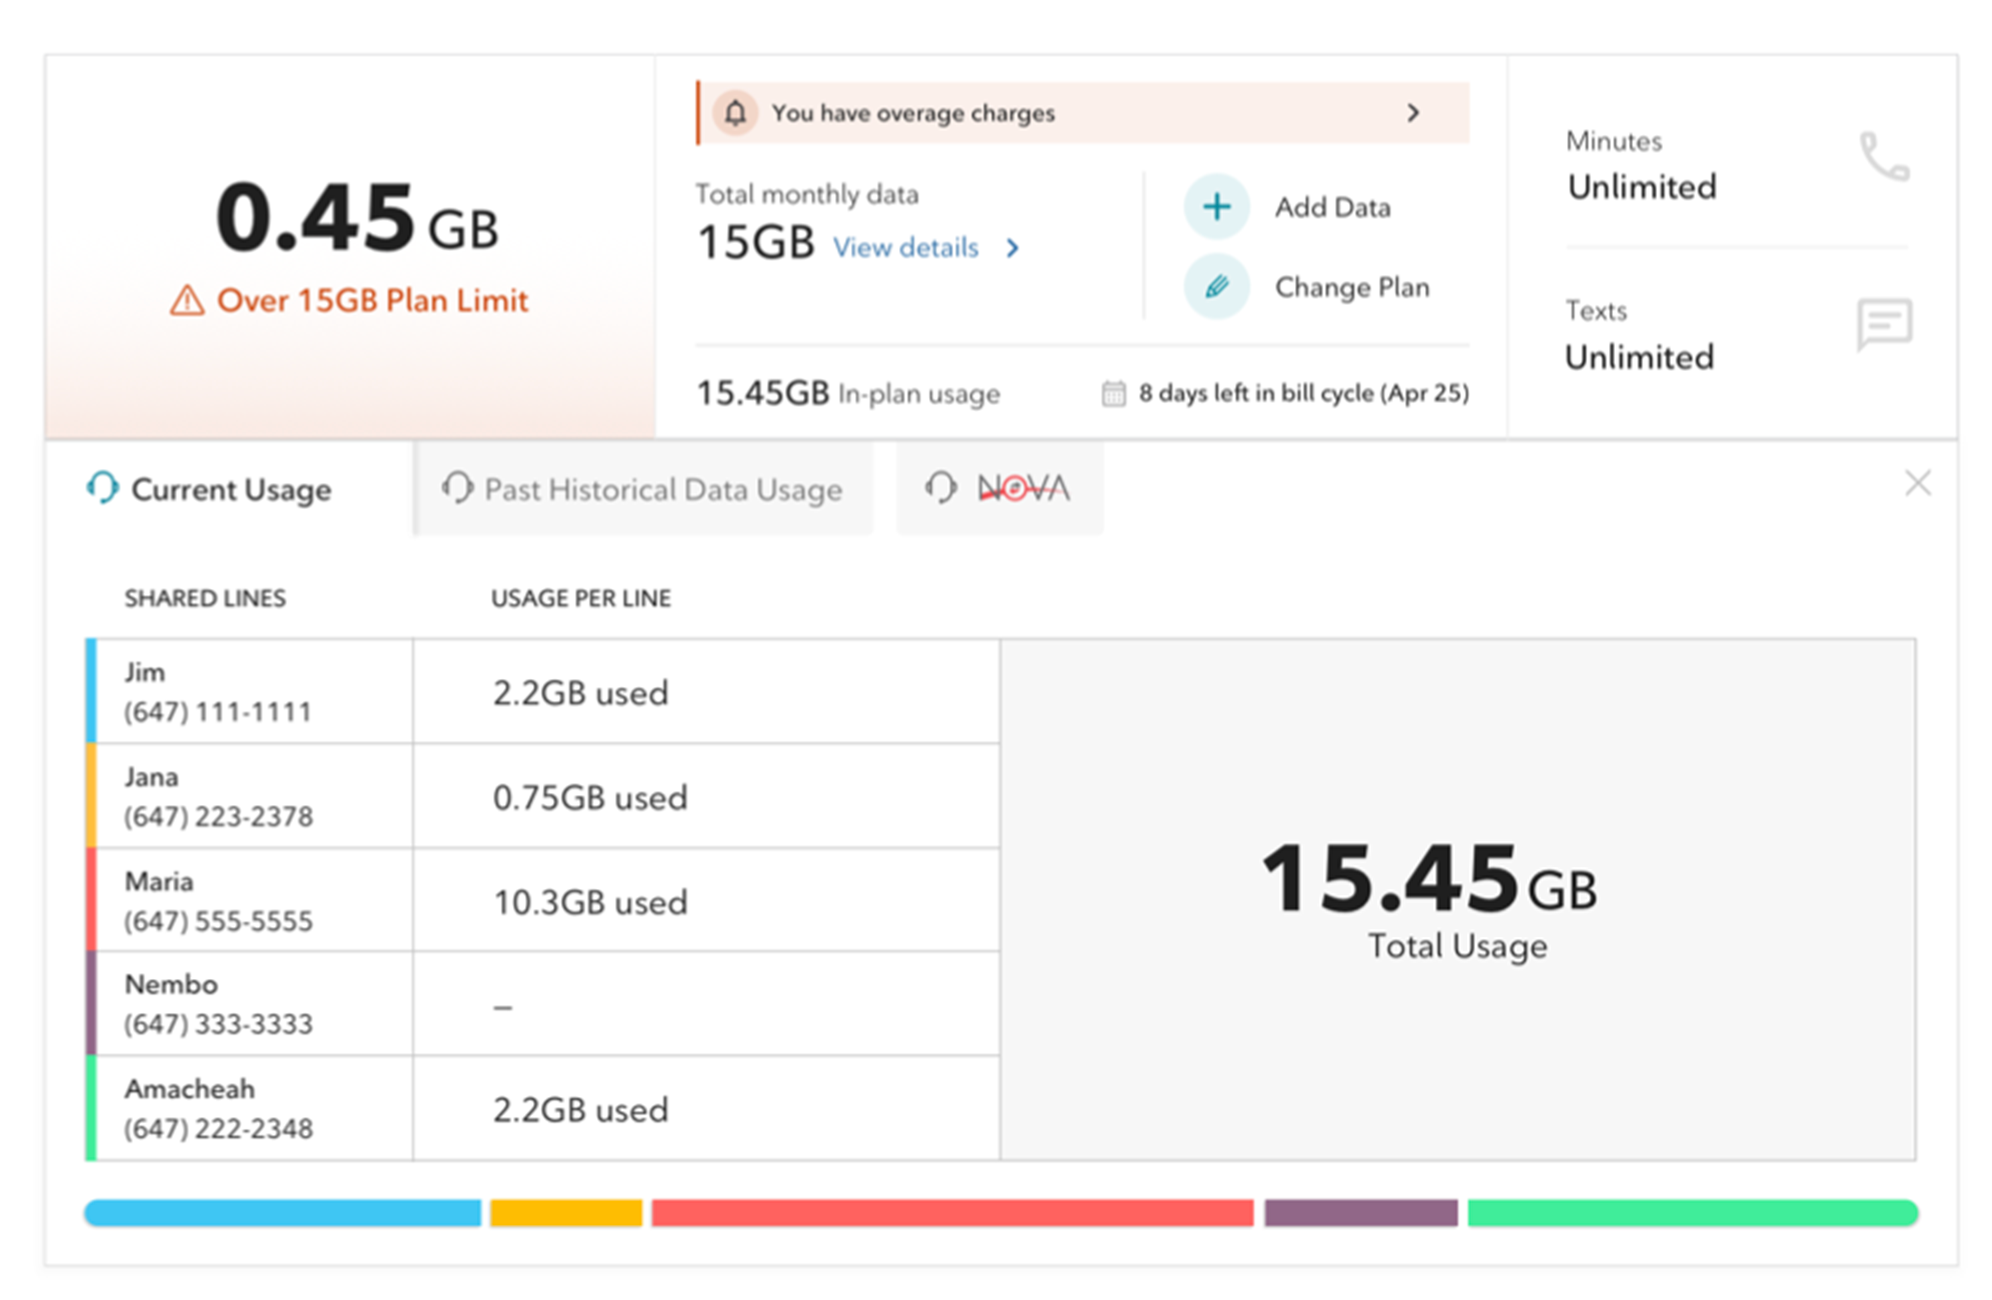
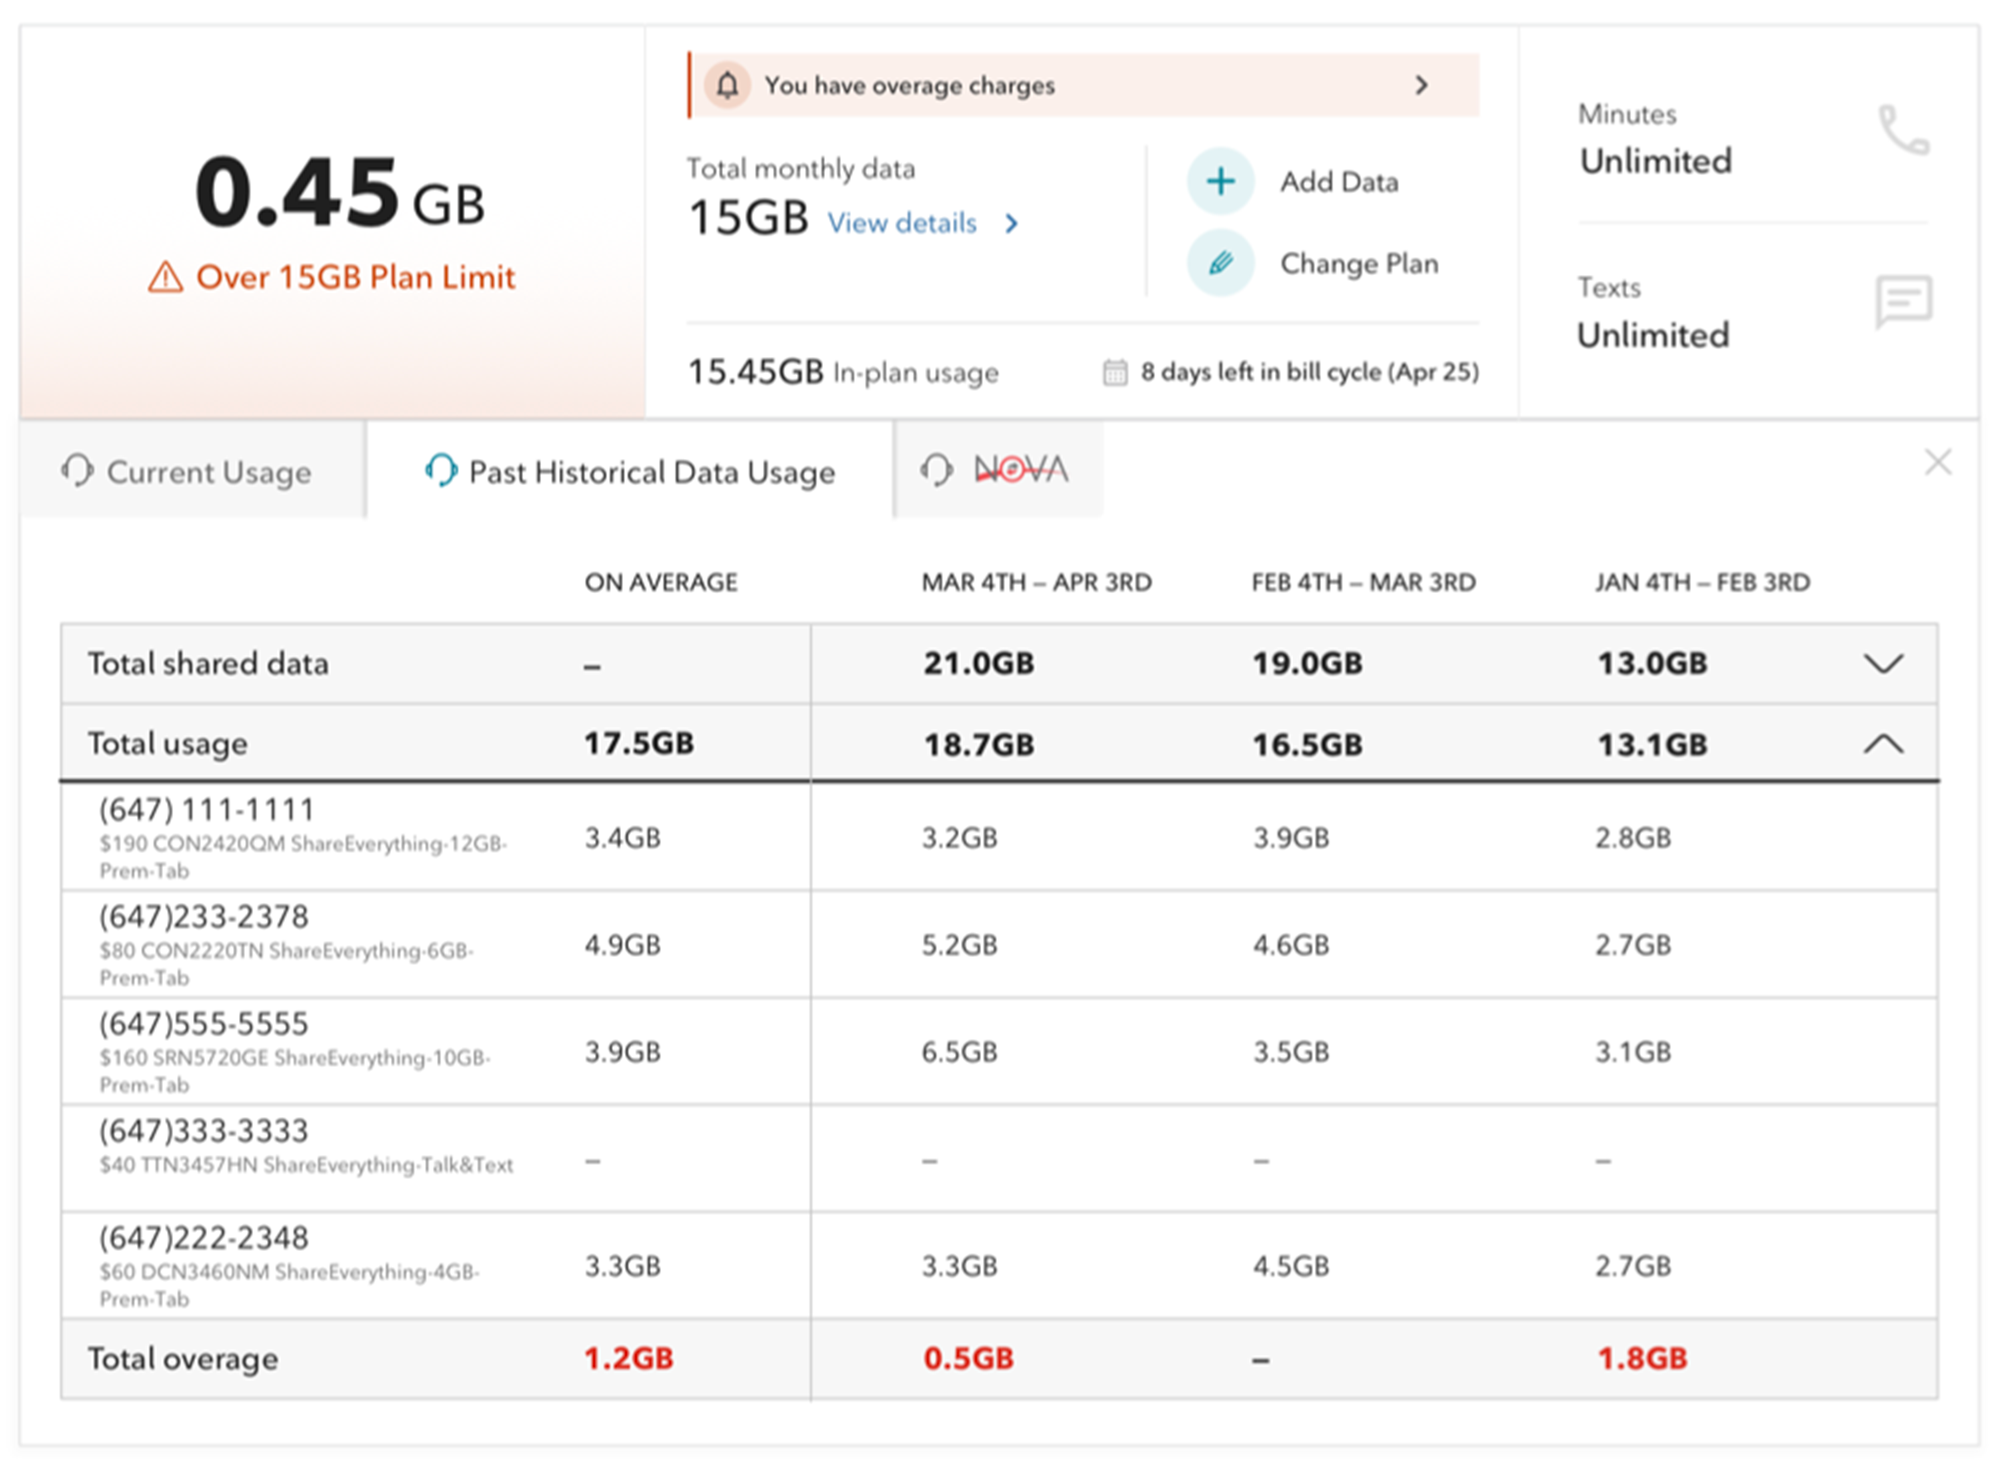
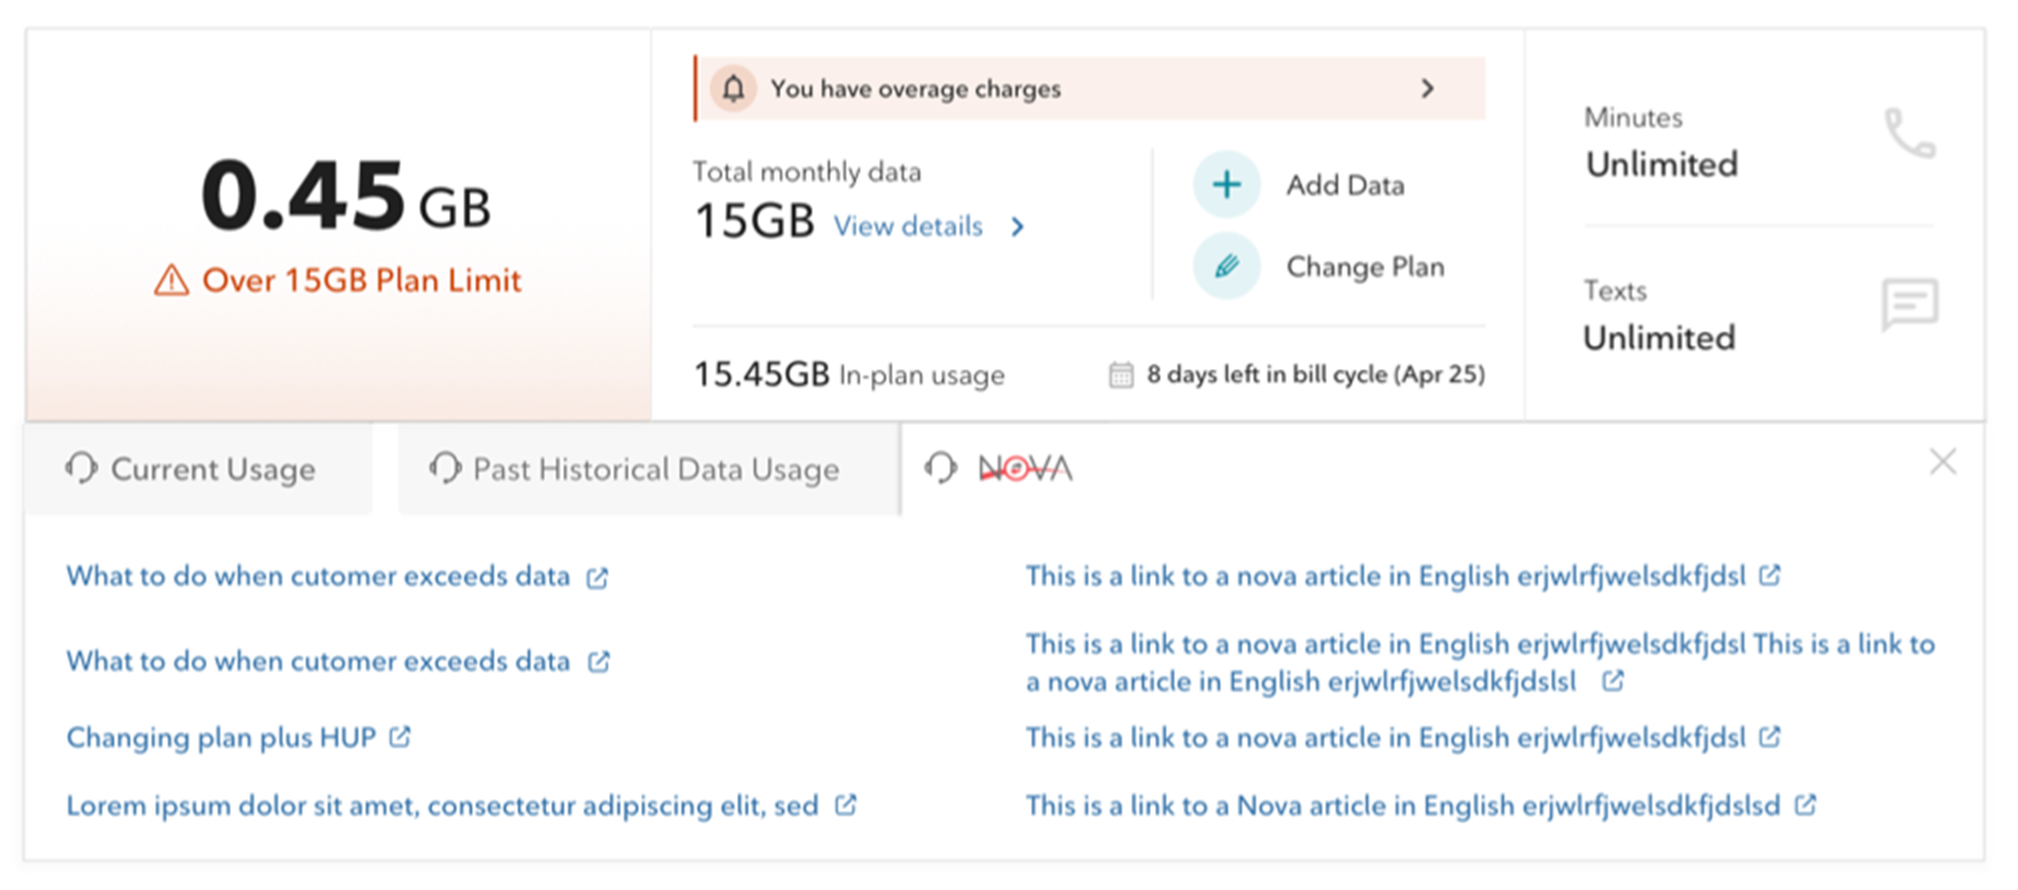
The Agent Insight chip was created as a new component that can be plugged into any major UI block to surface relevant agent-specific data (reporting, policy, tool instructions). In this dashboard, three chips sit on the base layer, each triggering a corresponding data table:
Historical usage reporting data.
Policy and instructional articles.
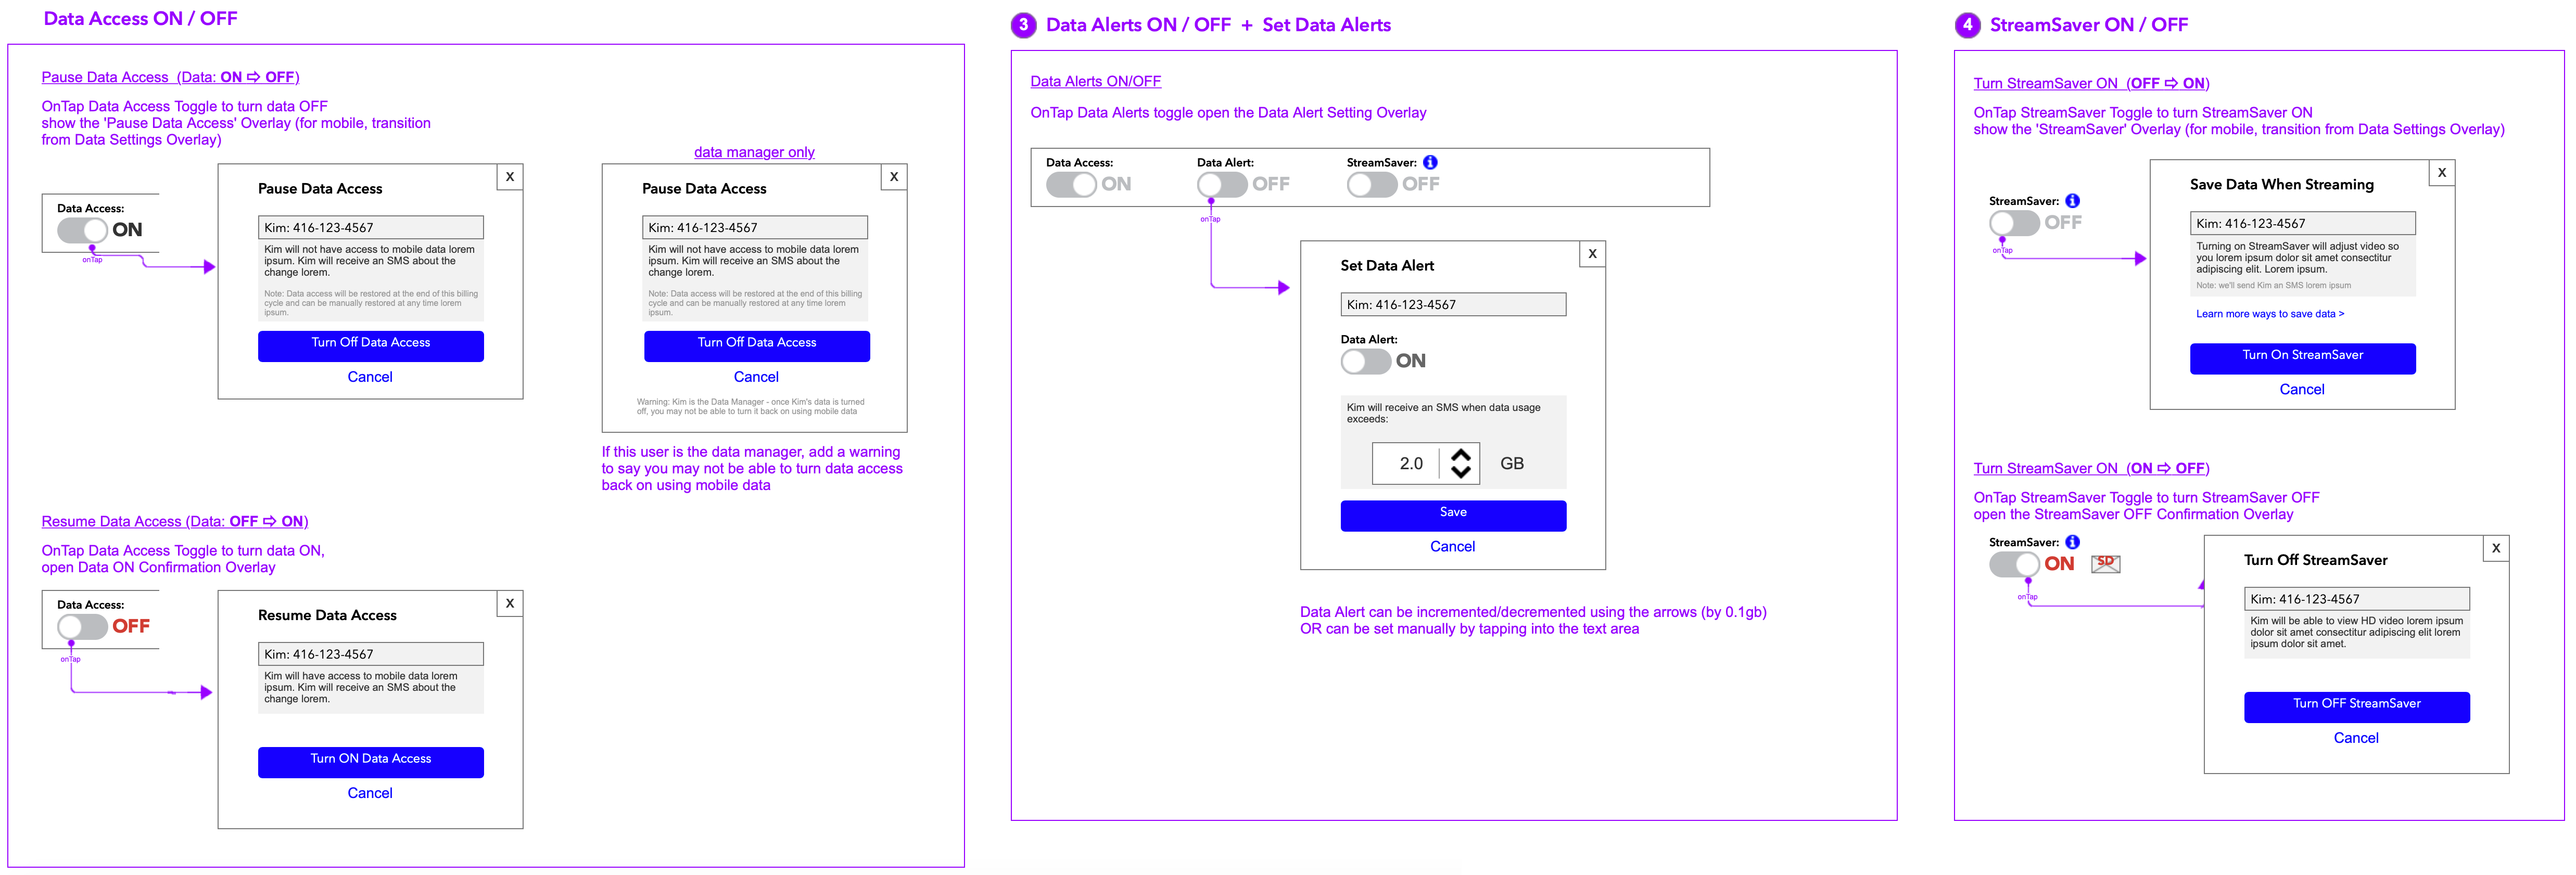
Interaction Flow Design — Example
After the page architecture was established, the team worked through the detailed task flows and interaction design. Below is an example flow — data access management.
Final Mocks
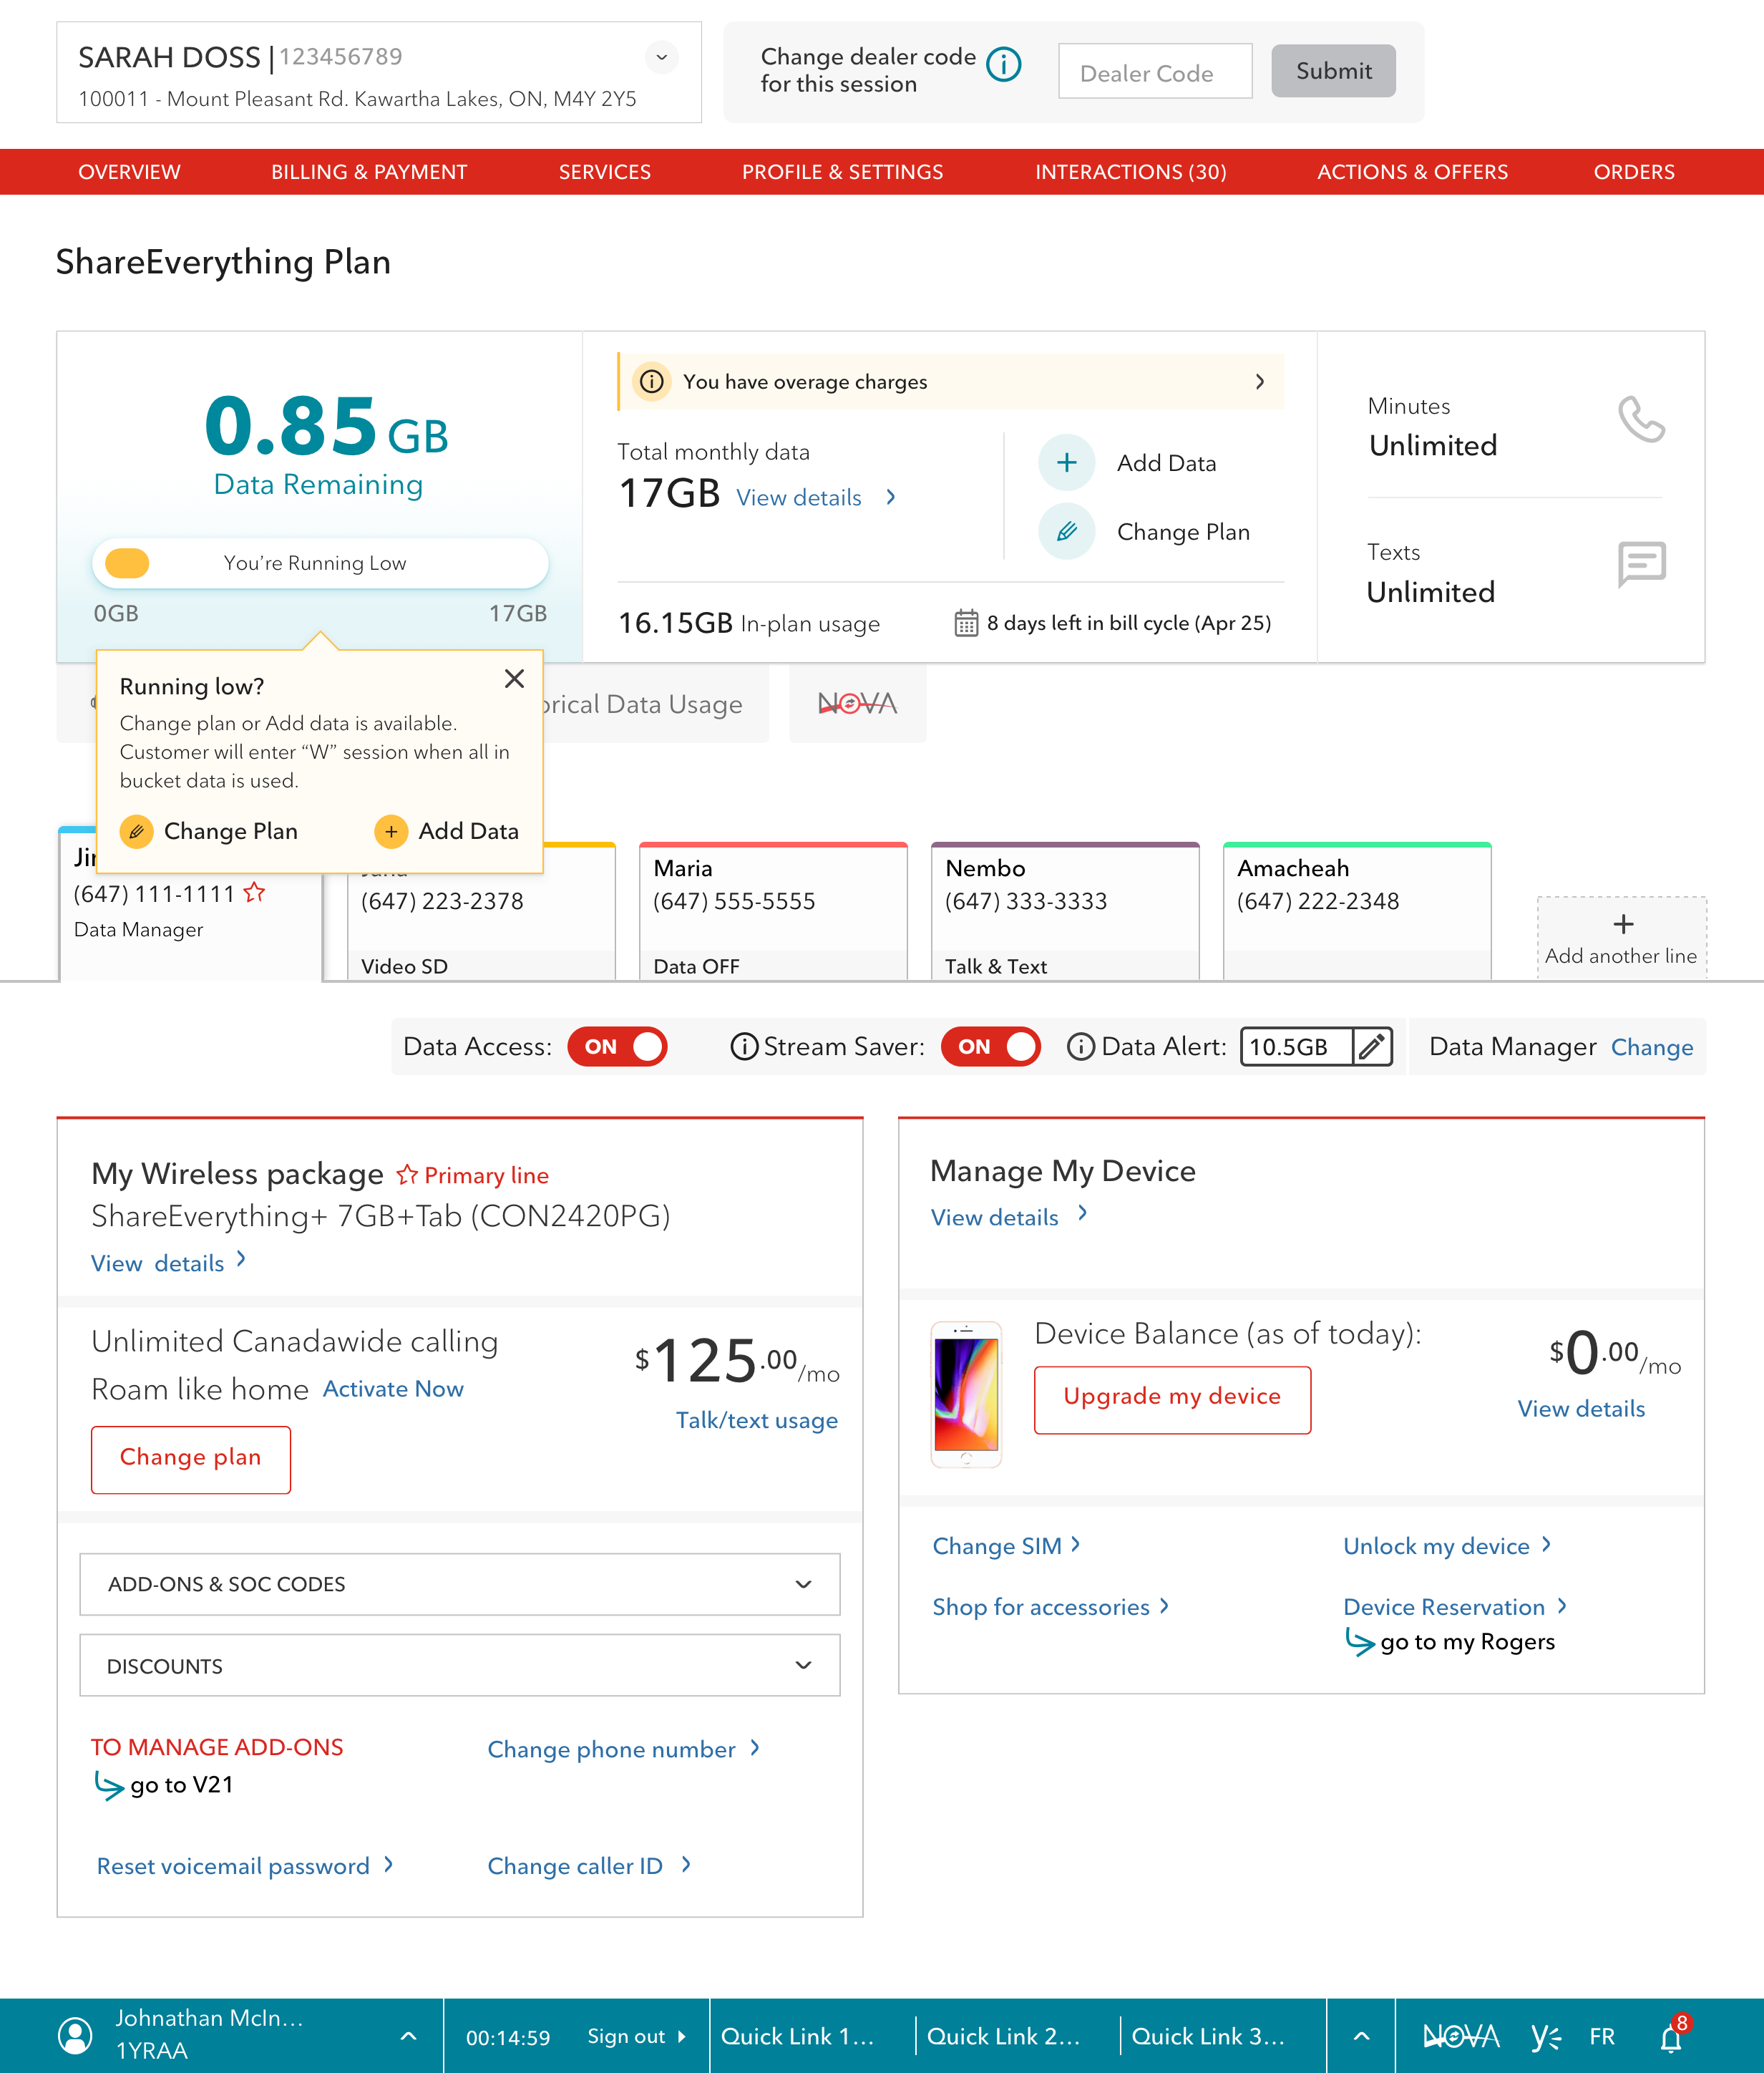
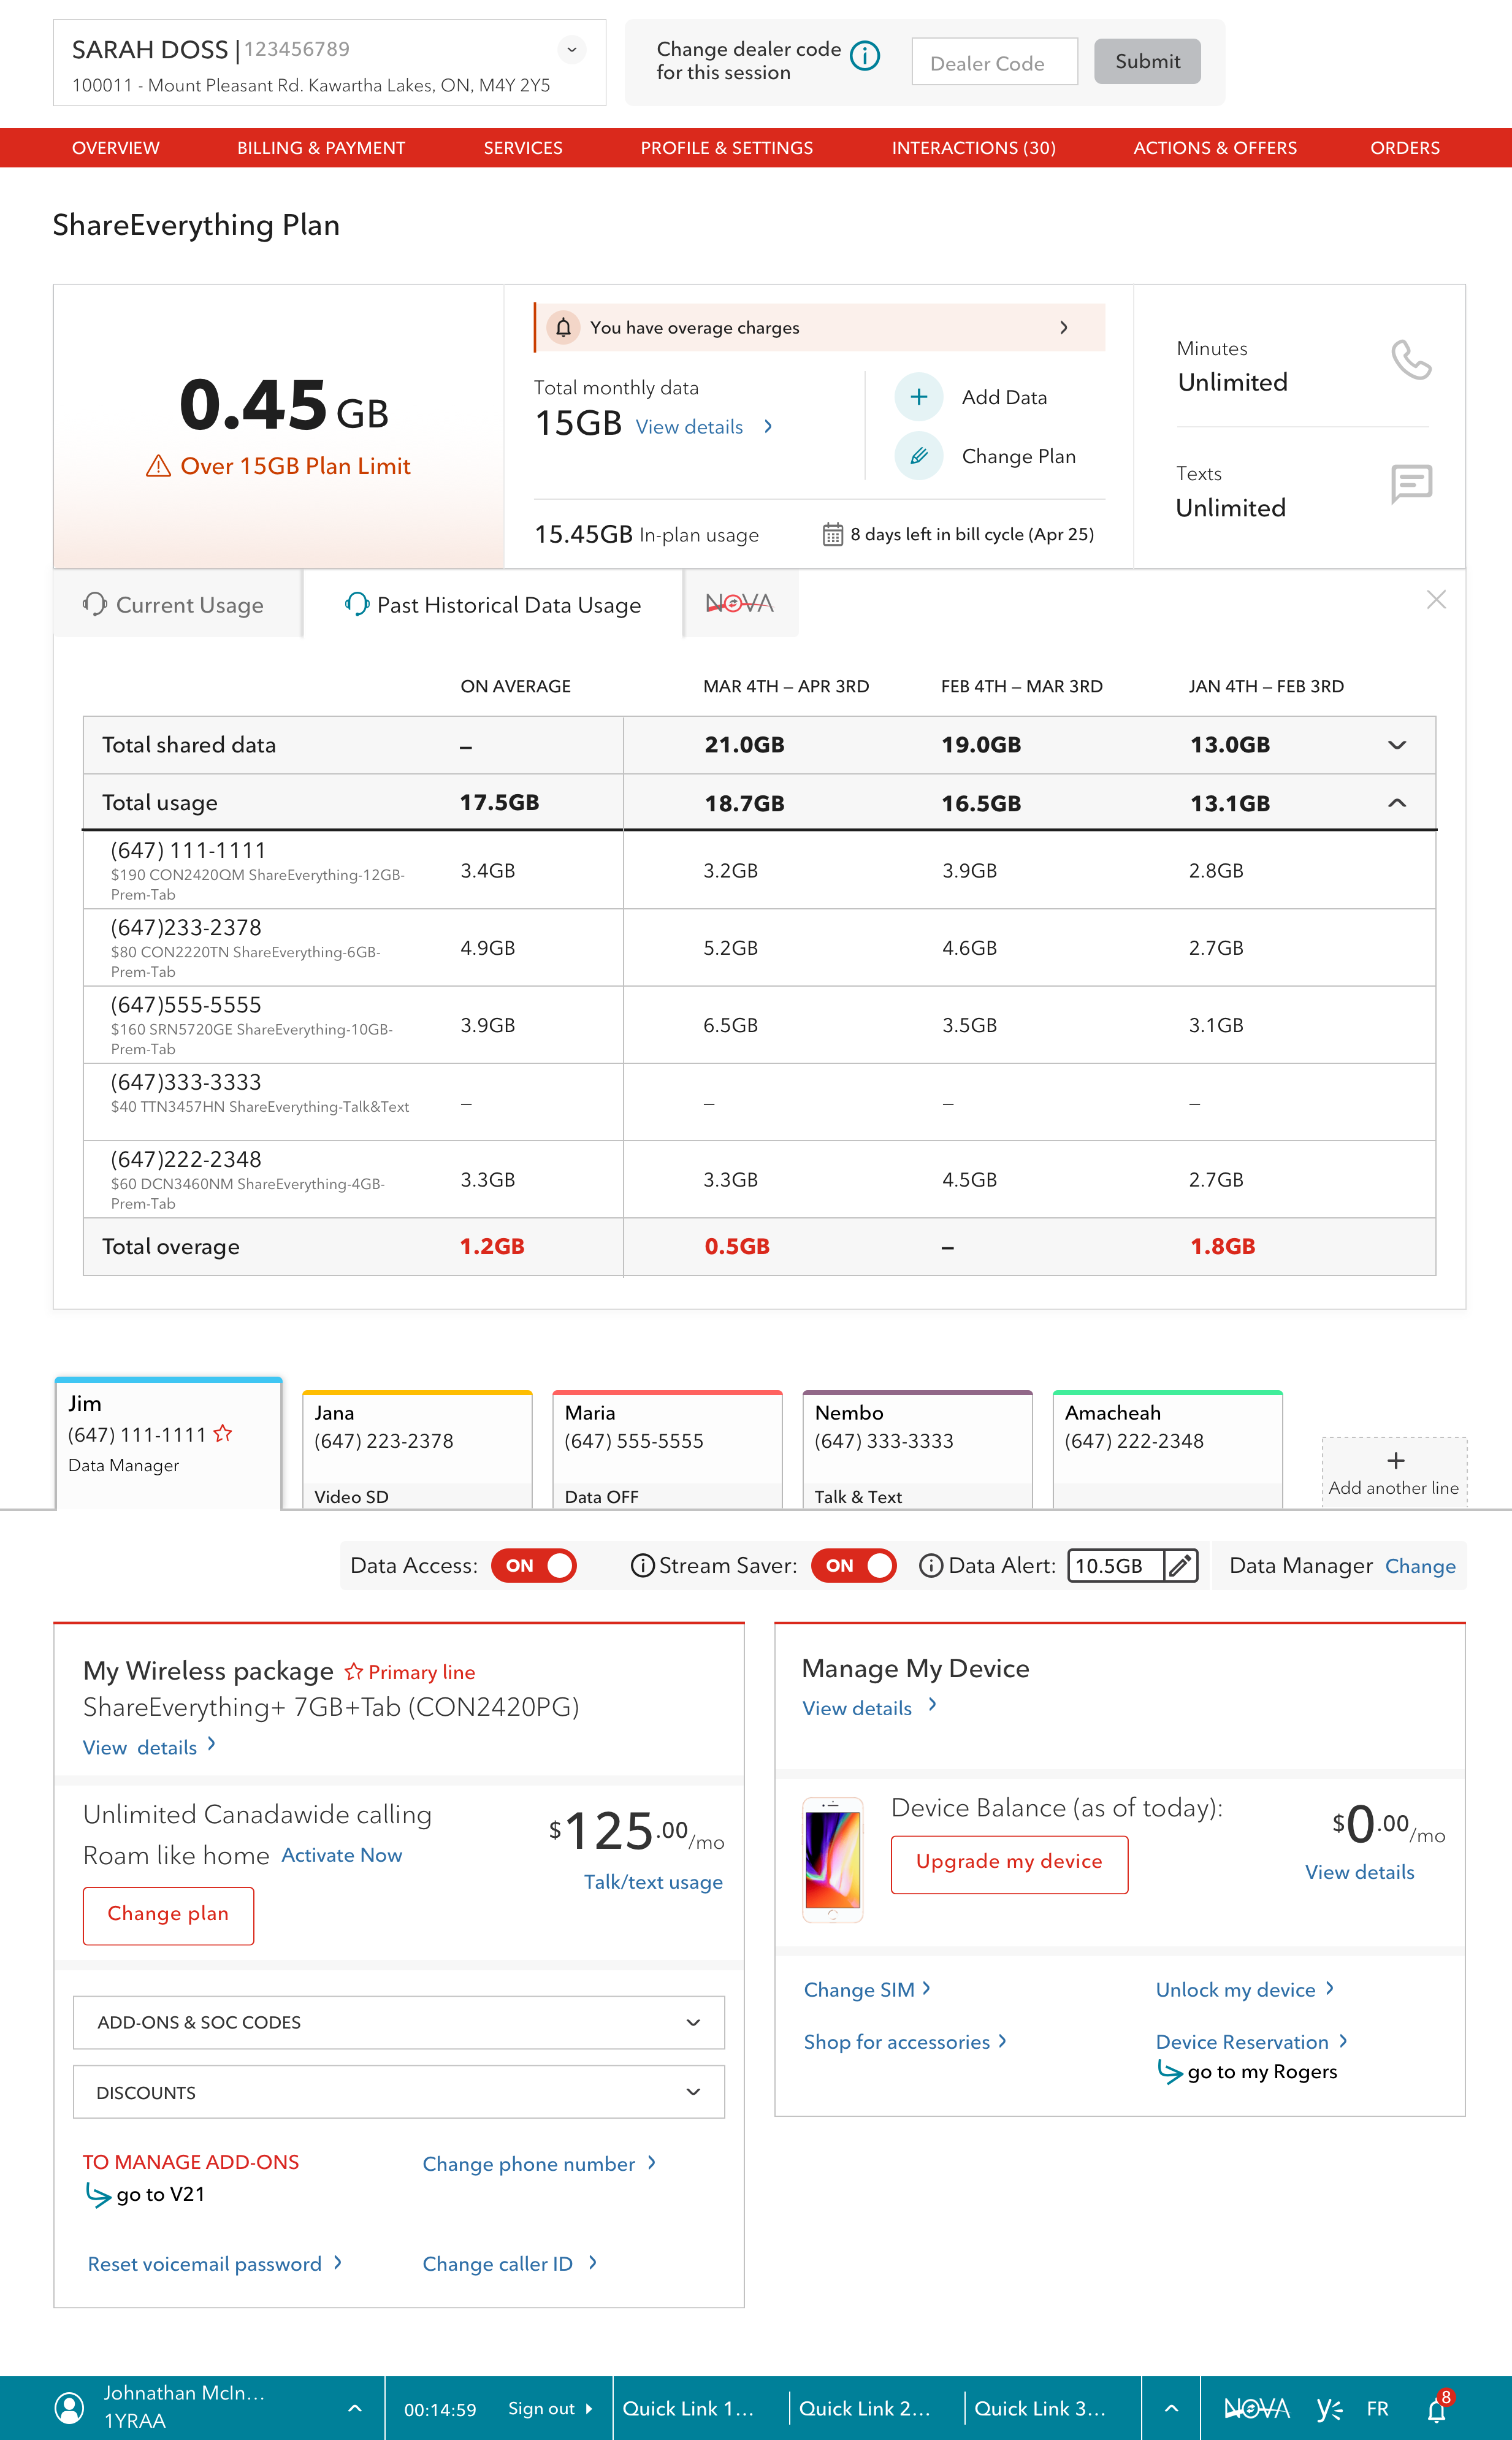
Brand A
Landing page:
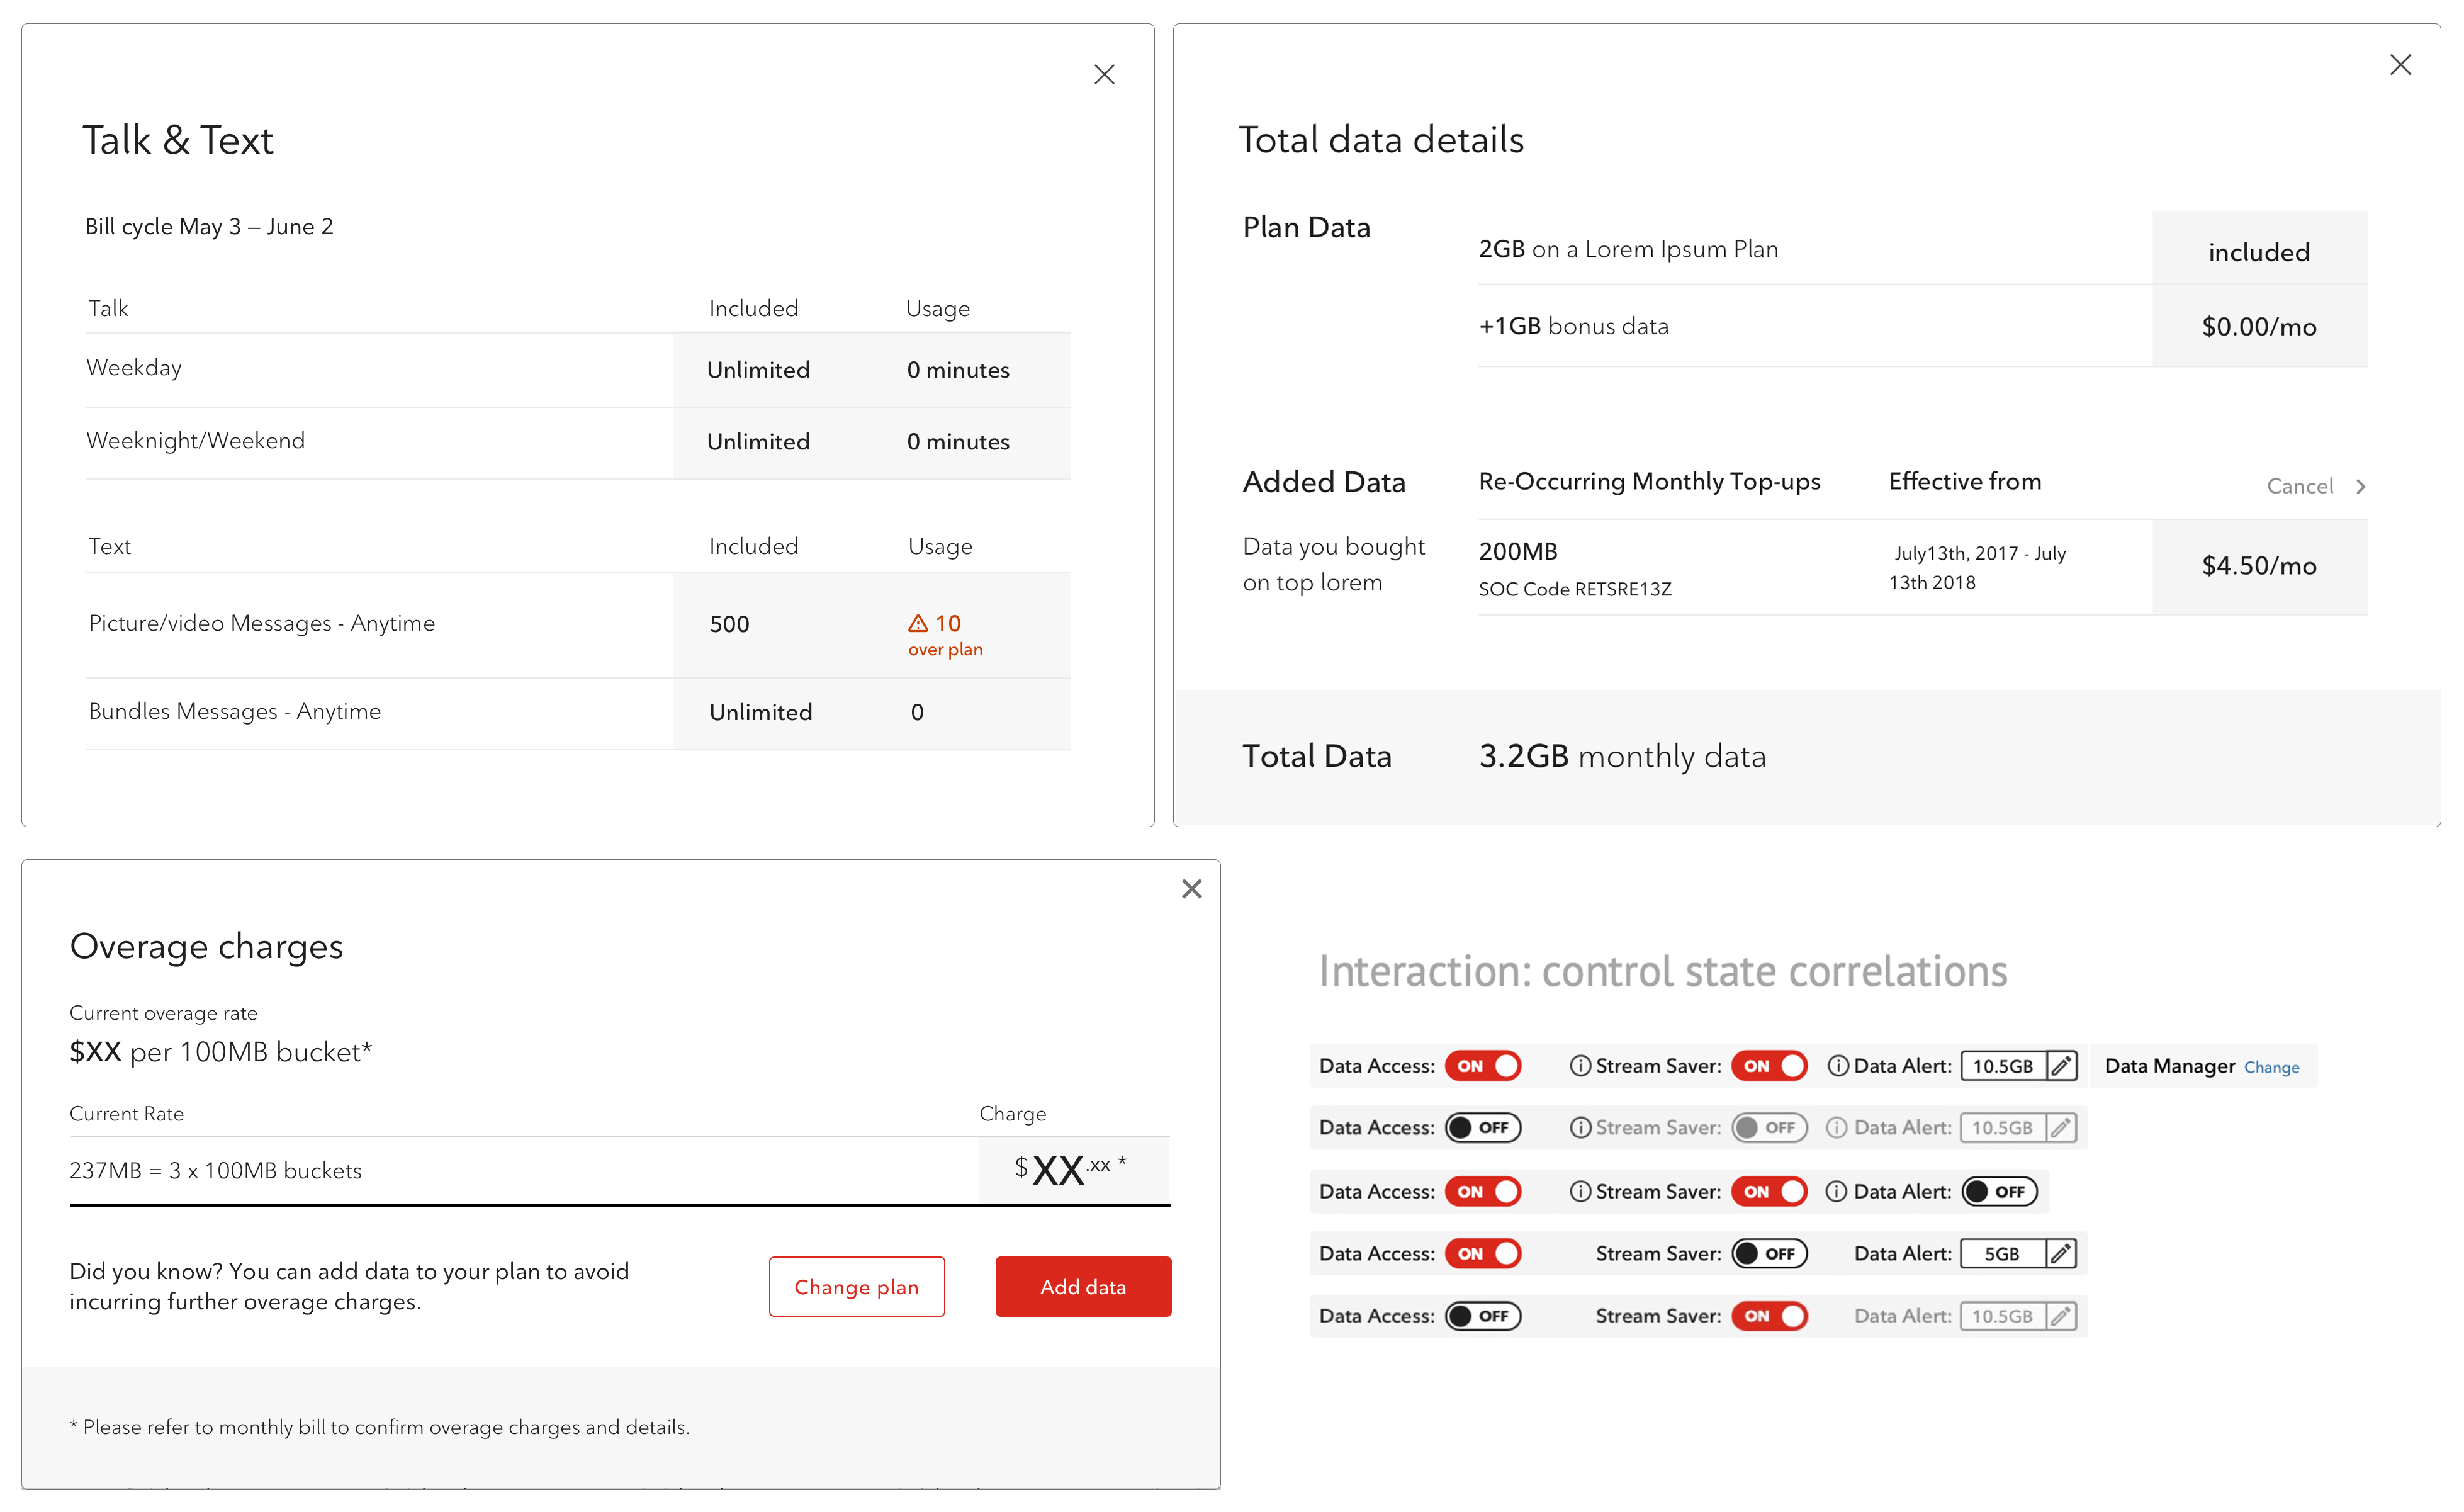
Modal and control elements in task flows:
Brand B
Landing page:
Responsive tablet view:
Modal and control elements in task flows: